

New data reveal how home insurance companies have hiked rates and suppressed claim payouts, generating $113 billion dollars of excess underwriting profit over the last five years. Rather than helping customers adapt and reduce climate risk, the industry funnels these profits into financial markets, boosting investment income and enriching executives and shareholders.
Introduction
For years, insurance companies have blamed more frequent and costly disasters for aggressive rate hikes and market withdrawals, decisions that make it harder for homeowners to find or pay for adequate coverage and pose broader risks to the financial system. In most U.S. counties, home insurance now costs more than annual property taxes. Some households are choosing to reduce insurance coverage or go without insurance altogether, leaving them vulnerable in the event of a disaster.
The National Association of Insurance Commissioners (NAIC) coordinates and sets standards for state insurance regulators and releases industry data. Based on an analysis of the NAIC’s market share reports from 2021 to 2025 for the home insurance industry, rising insurance costs cannot be fully explained by growing climate losses, increasing reinsurance costs, or inflation. Excessive industry spending and high profits are also to blame.
The data show that home insurance premiums have risen much faster than claims costs, leading to a jump in insurer profits. A common insurance industry measure of profitability, company loss ratios—how much a company pays out in claims compared to the premiums it collects—have declined significantly.
Between 2021 and 2025, home insurance premium revenue has increased by almost 60 percent. All but one of the ten largest property and casualty (P&C) insurers increased premium revenue in their home insurance line by at least 40 percent. In the same period, claims payouts increased at only half the rate of premium revenue. As a result, loss ratios in the home insurance market fell by 20 percent, from 69 percent in 2021 to 55 percent in 2025.
Declining loss ratios are in part the result of aggressive insurer rate hikes. A review of rate filings from 2021 to 2025 reveals successive years of double digit rate increases. Regulators often approved or allowed these increases to go into effect with little scrutiny, even for insurers posting extremely low loss ratios. Loss ratios for home insurance averaged around 74 percent in the 1990s, compared to 65 percent from 2021 to 2025 and 48 percent in the first half of 2026. Meanwhile, consumers who want to understand why it is so unaffordable to insure their homes face a nearly impossible task of navigating a rate filing and review system that is virtually inscrutable, as described in Appendix B.
Claim delay and denial also contributes to the gap between premium revenue and claims payments. Across the country, insurance companies closed 30 percent of policyholder claims without payment between 2021 to 2025, and over 22 percent of claims payments were delayed beyond 60 days. Insurers are incentivized to delay claims to keep premium dollars invested in income generating securities. Lower claims payouts also reflect reduced coverage as insurers dropped some existing policies, raised deductibles and capped coverage on others, and stopped covering perils like wind and hail in certain regions.
The resulting gains for the industry are striking. We estimate that insurers generated $258 billion in underwriting income from homeowners and renters between 2021 and 2025. Home insurers historically paid out about 70 to 80 cents of every premium dollar in claims. If rates were regulated so that claims payouts made up 80 percent of the premiums collected, as proposed by a Vanderbilt Policy Accelerator researcher, underwriting income over this period would have been $113 billion less. This money should have stayed in consumers’ pockets rather than going towards wasteful corporate excess expenses and profit. In this report, we define this figure as excess underwriting income, the gap between insurers’ realized underwriting income and underwriting income had loss ratios been anchored at 80 percent.
Insurance companies should apply some of this excess underwriting income towards adaptation that can protect their customers. Home insurers’ excess underwriting income dwarfs current federal government spending on climate adaptation. The U.S. government spent about $4 billion per year on flood adaptation through the Army Corps of Engineers, the Federal Emergency Management Agency, and the U.S. Department of Housing and Urban Development combined, and only $7 billion annually for wildfire management and suppression by the Forest Service and Department of Interior. Despite the fact that climate adaptation and resilience projects can reduce damage and lower future claims costs, insurers spend comparatively little to help homeowners and small businesses afford these investments.
These trends suggest that the public is paying unnecessarily high prices and getting comparatively less in payouts for home insurance compared to previous decades. Insurance regulators and state lawmakers must adequately oversee insurers to rein in this behavior so that individual homeowners are not padding insurance industry profits in the midst of an affordability crisis and accelerating climate change.
Roadmap of This Report
In Part 1 of this report, we analyze national trends in home insurance markets, including changes to premium revenue, loss ratios, claims payments, and excess underwriting income.
In Part 2, we dig into five states where home insurers posted extremely low loss ratios in 2025: Texas, Iowa, Idaho, Maine, and Florida. We highlight the major insurers with the lowest loss ratios in those states and review their average rate increases over the last five years. This analysis reveals that even as insurers were making high profits, they continued to raise rates with little regulatory scrutiny.
In Part 3, we identify opportunities for insurer investment in adaptation in the states mentioned above. A small fraction of the excess underwriting income generated by the insurance industry since 2021 could help hundreds of thousands or even millions of households adapt to growing climate risks if reinvested in or granted for adaptation measures. These investments in adaptation can also help keep insurance affordable and available.
In Part 4, we make policy recommendations to address profiteering in the home insurance industry and promote climate adaptation. We recommend policymakers consider prior loss ratios in rate regulation, strengthen oversight of insurer rate increases, require insurers to invest in and reward climate resilience, increase oversight of insurer claims handling, and increase transparency over insurer underwriting, pricing, and claims decisions so consumers can meaningfully compare insurers.
Part 1. National Home Insurance Trends
Home Insurance Premium Revenue Grew by 59 Percent—Over Twice as Much as Claims Payouts
Across the country, homeowners and renters are paying dramatically more for property insurance (see Map 1). In 2025, insurance companies earned $181.2 billion in premiums from homeowner multi-peril policies. That was up 59 percent from 2021, when the industry brought in $113.9 billion in premium revenue.
Map 1. Growth in Home Insurance Premiums Collected, 2021-2025
In Utah, the state with the largest increase in the study period, the industry collected about $690 million from households in 2021, rising to $1.34 billion in 2025—an increase of nearly $650 million in just five years (see Table 1). As a result, owning a home has become even more expensive in a state where housing is already unaffordable for many.
Table 1. Growth in Home Insurance Premiums Collected, 2021-2025
The increase in premium revenue is due to a variety of factors, including growth in the number of households, construction cost inflation, increasing home values, growing climate-related risks and the higher losses insurers expect as a result, and aggressive rate increases.
Nationwide, in the study period, “direct losses,” the amount insurers pay out in claims, rather than the total economic damage caused by disasters, increased 28 percent in the U.S. home insurance market, jumping from $78.4 billion in 2021 to just over $100 billion in 2025. Global insurance and brokerage firm Aon estimates that weather-related disasters caused $141 billion in economic losses in the United States in 2025. That was down 35 percent from 2024, when losses reached $218 billion, but still above the 21st-century average of $117 billion. Even as insured losses rose between 2021 and 2025, premium revenue increased more than twice as much as claims payouts (see Chart 1). One estimate from the first half of 2026 suggests that this gap could grow further still.
Chart 1. Growing Divergence Between Premiums and Claims Payouts, 2021-2025
The divergence between insurers’ rising premiums and stalling claims payouts is driven by several factors. First, as discussed above, insurers have increased rates at an unprecedented pace from 2021 through 2025. For consumers, premiums have increased by an estimated 46 percent since 2021. Second, insurers are withdrawing from climate-vulnerable communities. Companies are dropping properties in certain areas with heightened climate risk, in some cases, even if the homeowner has paid for resilience upgrades to their property. Third, insurers are delaying, underpaying, or failing to pay out the claims they owe, leaving people without the protection they paid for. Finally, there were relatively few high-cost catastrophe events in the U.S. in 2025, with the notable exception of the Los Angeles wildfires in January. This relative lull has helped insurers hold on to a greater share of premiums collected, improving financial results, but does not account for the entire rise in profitability.
Home Insurance Loss Ratios Fell by 20 Percent—Meaning Insurers Kept Greater Share of Premiums
The widening gap between higher premium growth and lower claims payouts benefits insurers by allowing them to keep a larger share of the money they collect from consumers. This is reflected in insurers’ loss ratios, or the percentage of premiums they pay out in claims.
In 2025, the loss ratio in the U.S. home insurance market was 55.1 percent. This means that for every $100 insurers collected in premium revenue, they only paid out $55 in claims to policyholders and kept $45. That retained money can go toward legitimate business costs, like employee salaries, claims administration, reinsurance, and other necessary operating expenses. But insurers can also use it for discretionary spending, including advertising, executive compensation, perks like private jets, and legal expenses related to fighting policyholders so they don’t have to pay their claims. Such a low loss ratio maintained over multiple years suggests that insurers are charging policyholders too much, paying out too little in claims, or both.
There are several ways to measure profitability through loss ratios. One is looking at a company’s direct loss ratio, or how much a company pays out in claims compared to the premiums it collects. Another is to look at its net loss ratio, or the ratio of premiums collected paid out as claims after accounting for reinsurance costs. In this report, we use direct loss ratios except where otherwise noted. (See Appendix A for further justification of analyzing loss ratios.)
Underwriting loss ratios do not include investment gains, which is a major source of insurance industry profits. Writing coverage gives insurers access to vast amounts of interest-free premium capital that they invest and in turn reap gains that are not usually shared back with policyholders. In fact, in a competitive market, modest underwriting losses are common, a price insurers pay for accessing policyholders’ premium dollars to invest in income generating assets. Insurers make investment returns on reserves and surpluses built up over time from premiums collected from policyholders.
The national home insurance loss ratio has steadily declined, falling from 68.8 percent in 2021 to 61.5 percent in 2024, and just 55.1 percent in 2025, and only 48.4 percent for the first half of 2026. The 2025 loss ratio was approximately 20 percent lower than in 2021 (see Chart 2).
Chart 2. Declining National-Level Loss Ratios, 2021-2025
In 2025, some states had exceptionally low loss ratios, meaning insurers held onto much of the premiums they collected. These include Hawaii, where insurers paid out just eight cents of every dollar collected in premiums (8%), Florida (11%), New Mexico (22%), Louisiana (23%), and South Carolina (26%) (see Table 2).
Loss ratios naturally fluctuate from year to year, depending on the severity of disasters, especially in states seeing an increase in climate-related catastrophes. Changing weather patterns are increasing the risk of losses, meaning this volatility will likely increase. The industry also moves through multi-year or decadal underwriting cycles, with periods of high premium growth and profit followed by more competitive pricing and lower profit.
Despite this variability, several states have consistently had particularly low loss ratios. From 2021 to 2025, five-year average loss ratios were lowest in Massachusetts (37%), Maine (41%), New Hampshire (45%), Vermont (45%), and Rhode Island (47%) (see Map 2). Looking back even further, average loss ratios have dropped since the 1990s (see Chart 3), suggesting a structural shift where insurers return less benefit to policyholders. These trends extend beyond the normal swings of underwriting cycles and warrant greater regulatory scrutiny.
In the study period, insurers’ falling loss ratios translated to record corporate profits while policyholders struggled to pay their bills. The result is unnecessary financial strain for policyholders, including rising household debt and mortgage delinquencies, and growing risks to local economies and the broader financial system from uninsured and underinsured homes.
Map 2. Average State-Level Loss Ratios, 2021-2025
States that saw the largest reductions in loss ratios were Louisiana (94% decrease), Hawaii (81% decrease), Florida (80% decrease), Colorado (66% decrease), Iowa (65% decrease), and New Mexico (60% decrease) (see Table 2).
Table 2. Change in State-Level Loss Ratios, 2021-2025
Evidence of Home Insurance Price Gouging: Up to $113 Billion in Excess Underwriting Income
The industry’s preferred method of accounting for underwriting profitability is not loss ratios, but combined ratios. A combined ratio measures how much an insurer spends as a percentage of its premium revenue on claims, plus its operating expenses. It is calculated by adding the loss ratio and expense ratio, or the percentage of premiums a company spends on things like salaries and marketing. The combined ratio often approaches and occasionally exceeds 100 percent, allowing insurers to claim that they are barely breaking even. In reality, in healthy markets, insurers often primarily make their money on investments, so small underwriting losses are normal, and not a sign that prices are too low. Combined ratios are not a good measure of profitability because many of the included expenses—such as bloated advertising budgets, agent fees, money spent fighting claims, and soaring executive compensation—could be reduced or, in the case of private jet purchases, eliminated.
A better way to assess whether insurers are generating excessive profits is to compare their actual loss ratios with a proposed minimum. In a revealing paper, Brian Shearer of the Vanderbilt Policy Accelerator evaluated historical loss ratio data for the U.S. property and casualty insurance industry, and concluded that a fair average minimum loss ratio would be 80 percent, similar to that set for the health insurance industry, which saw declining loss ratios in years preceding the establishment of a loss ratio floor. That would leave 20 cents of every premium dollar to cover salaries and other expenses, with room to cut costs like stock buybacks if companies want higher underwriting profits. Using that figure as a benchmark, Shearer recently found that P&C insurers are overcharging U.S. consumers by as much as $150 billion per year.
Examining home insurance loss ratios from 1988 to the first half of 2026, there has been a clear overall downward trend since the 1990s despite yearly fluctuations. This has left companies with a larger share of premium revenue to generate profits (see Chart 3)
Chart 3. Home Insurance Loss Ratios Have Trended Downward Since 1990s
Over the 35-year period between 1991 and 2025, the national average loss ratio was 65.6 percent. The net downward trend in loss ratios was most noticeable during the first three decades. From 1991 to 2000, the average loss ratio was 73.4 percent. During the next decade, 2001 to 2010, the average loss ratio fell to 63.2 percent. From 2011 to 2020, the average loss ratio declined even further, to 60.4 percent. This means that each decade, insurers paid out a progressively smaller share of the premiums they collected in claims.
More recently, between 2021 and 2025, the five-year average loss ratio was 65.4 percent. However, annual loss ratios fell significantly in 2024 and 2025, and preliminary data from the first half of this year suggest that another decrease is likely in 2026. The current downward trend reflects a combination of temporary meteorological luck and increasingly unscrupulous insurer practices, including coverage withdrawals, aggressive rate hikes, and claims denials.
A loss ratio of 65 percent leaves insurers with a 35 percent margin to cover operating expenses. A minimum loss ratio of 80 percent would require insurers to pay out at least 80 cents in claims for each premium dollar collected—five cents more than they did in the 1990s, 15 cents more than they have over the past decade, and 25 cents more than they did in 2025. That would bring payouts closer to historical levels: In the 1990s, home insurance industry loss ratios averaged 74 percent. An 80 percent minimum, while higher than the 1990s average, is an appropriate benchmark because insurers have long benefited from a patchwork system of weak rate regulation that allows them to overcharge and shortchange consumers in many states, obtaining unreasonably high profits in the process.
As climate change increases the frequency and severity of extreme weather, homeowners are likely to face more damage and turn to their insurer more often, necessitating stronger consumer protections. Insurers can absorb mounting damages with an 80 percent minimum loss ratio and still have a 20 percent margin to cover necessary operating costs and maintain adequate reserves and surplus. They may, however, have to reduce frivolous spending on things like advertising, outlandish executive pay packages and perks, and shareholder dividends, expenses that insurance regulators could cap outright to prevent unnecessary premium increases.
Using NAIC data on annual home insurance premiums and loss ratios, we calculated total underwriting income before expenses from 2021 to 2025. We estimate excess underwriting income each year by contrasting actual underwriting performance against a counterfactual scenario in which an 80 minimum loss ratio exists.
From 2021 to 2025, U.S. insurers collected $725.5 billion in home insurance premiums. Based on annual nationwide loss ratios, we estimate that during that five-year period, insurers generated $258 billion in underwriting income after paying claims. Compared with a minimum loss ratio of 80 percent, insurers generated an estimated $112.8 billion in excess underwriting income over the past five years (see Chart 4 and Table 3).
Those gains were especially pronounced in 2025, when the national loss ratio was just 55.1 percent. In contrast to a scenario with an 80 percent loss ratio, excess underwriting income reached $45 billion. The pattern was similar in 2024. With a national loss ratio of 61.5 percent, insurers overcharged and underpaid consumers by $30 billion.
Chart 4. Excess Underwriting Income Reached $113 Billion, 2021-2025
Table 3. Excess Underwriting Income Reached $113 Billion, 2021-2025
30 Percent of Home Insurance Claims Were Denied
Insurance companies are also maximizing profits by closing a staggering number of claims without payment. A recent investigation by the Wall Street Journal found that the five largest home insurers failed to pay out anything in more than 44 percent of claims closed last year. That means that despite paying premiums for years, many policyholders still do not receive the money they are owed when disasters hit.
From 2021 to 2025, the share of claims insurers closed without paying anything averaged 29.9 percent nationwide, according to data from the NAIC. Last year, the ratio reached or exceeded 30 percent in 33 states. Over the five-year period, Washington D.C. saw the highest rate of claims closed without payment over this period (37%), followed by Vermont (35%), Maine (34%), Alaska (34%), and California (34%) (see Table 4).
While the NAIC data cover the entire market within each state, the Wall Street Journal analysis examined claims handled solely by the five largest homeowners’ insurers. Its higher rates suggest that claim nonpayment may actually be worse among those companies than across the market as a whole.
Lower claims payouts also reflect reduced coverage, as insurers dropped some existing policies, raised deductibles and capped coverage on others, and stopped covering perils like wind and hail in certain regions. Homeowners may now need two or three separate policies to fully insure their home, and may need to navigate different insurers, billing systems, and claims processes in the event of a disaster.
Table 4. Home Insurance Claim Denial Rate, 2021-2025
22 Percent of Home Insurance Claims Were Delayed
Insurers also profit by delaying claims payments. This allows them to keep premiums invested in income-generating assets for longer, while policyholders are forced to delay rebuilding or repair following a disaster. The Consumer Federation of America and Weiss Ratings estimate that for each day homeowners insurance companies delay claims payments, the industry collectively takes in an extra $8.8 million in interest and investment income.
Nationwide, the average percentage of claims paid out beyond 60 days was 22.6 percent in 2025 and 22.4 percent in the five year period between 2021 to 2025. The percentage of claims paid out beyond 60 days varied significantly by state, ranging from 13 percent (West Virginia) to 42 percent (Florida) in 2025, and from 14 percent (West Virginia) to 44 percent (Florida) over the last five years (see Table 5). After Florida, the states with the greatest share of claims paid beyond 60 days in the 2021 to 2025 period were Hawaii (37%), California (31%), Louisiana (29%), and Alaska (28%). Florida and Hawaii are noticeable outliers, with the share of claims paid beyond 60 days falling well above the national average.
Table 5. Home Insurance Claim Delay Rate, 2021-2025
Top 10 Home Insurers Increased Premium Revenue by 63 Percent as Their Loss Ratios Fell by 23 Percent
The following 10 insurance companies have earned the most premium revenue from U.S. homeowners and renters over the past five years: State Farm, Allstate, USAA, Liberty Mutual, Farmers, Travelers, American Family, Chubb, Nationwide, and Progressive. Collectively, their premium revenue grew by 63.4 percent during the study period, from $71.5 billion to $116.9 billion (see Table 6).
With the exception of Nationwide, each of the largest carriers increased premium revenue by at least 40 percent over the past five years. Leading the way was American Family, which more than doubled the amount of premiums it earned over the period, from $4.7 billion in 2021 to $9.7 billion in 2025. American Family’s market share grew modestly during those years, from 4.2 percent to 5.1 percent.
Table 6. Top 10 Home Insurers Increased Premium Revenue by 63 percent, 2021-2025
Loss ratios for the top 10 U.S. home insurers decreased by 22.8 percent during the same period, from an average of 69.2 percent in 2021 to 53.4 percent in 2025 (see Table 7). Last year, five of the companies had loss ratios under 50 percent: Liberty Mutual (49.9%), Farmers (48.8%), American Family (44.4%), Nationwide (38.2%), and Progressive (28.1%).
The lowest five-year average loss ratios among the top 10 firms were held by Chubb (56.3%), Progressive (56.5%), Farmers (60.4%), Liberty Mutual (61.2%), and American Family (63.3%).
These firms saw the biggest reductions in loss ratios from 2021 to 2025: Progressive (64% decrease), Nationwide (47% decrease), Farmers (31% decrease), American Family (29% decrease), Liberty Mutual (24% decrease) and Allstate (24% decrease).
Table 7. Top 10 Home Insurers’ Loss Ratios Fell by 23 percent, 2021-2025
Part 2: State and Company-Specific Analyses
Home Insurance Companies Raised Rates With Little or No State Objection, Despite Falling Loss Ratios
Although home insurance premiums climbed to a greater degree than claims payouts between 2021 and 2025, many states continued to allow carriers to raise premiums with little to no pushback (see Chart 5).
Chart 5. Home Insurers Raising Rates Despite Falling Loss Ratios, 2021-2025
Regulators differ in how closely they scrutinize rate increases, and the process and negotiations over hikes are largely opaque to the public in most states. Rate filings are hard to navigate, scattered across different state databases with confusing subsidiary names and in inconsistent formats (see Appendix B for methodology). That makes it hard for consumers to understand how their insurer compares to others or why their premiums are going up.
To examine these trends more closely, we focus on five states: Texas, Iowa, Idaho, Maine, and Florida. The first three stand out as states with both a top-10 decline in loss ratios and a top-10 increase in premium revenue from 2021 to 2025. In other words, insurers in these states are paying out a smaller share of premiums in claims even as the premiums they collected grew substantially. Together, they represent distinct regions with unique weather risks: Texas faces a wide range of hazards, including hurricanes, flooding, and hailstorms; Iowa is also exposed to hailstorms as well as tornadoes, derechos, and flooding; and Idaho faces frequent wildfires and hailstorms.
No state in the Northeast was in the top 10 for loss ratio decrease and premium revenue increase; we decided to further evaluate Maine as a state with consistently low loss ratios from 2021 through 2025. Finally, Florida is worth examining in its own right. The crisis of dwindling home insurance availability and affordability is especially pronounced in the state, and its response, centered on limiting the legal rights of policyholders, warrants closer attention.
At the state level, a few insurers stand out for having particularly low loss ratios concentrated in regional geographies, including Liberty Mutual in the Northeast, Midwest, and South; American Family in the Midwest, Farmers in the West, Chubb in New England, and Nationwide in the Mid-Atlantic (see Map 3). This might suggest that these insurers deploy more aggressive premium growth or cost containment strategies, such as claims denials, in these regions where they can rely on strong brand presence.
Map 3. Lowest Loss Ratio Home Insurer in 2025 (Minimum 3% State Market Share)
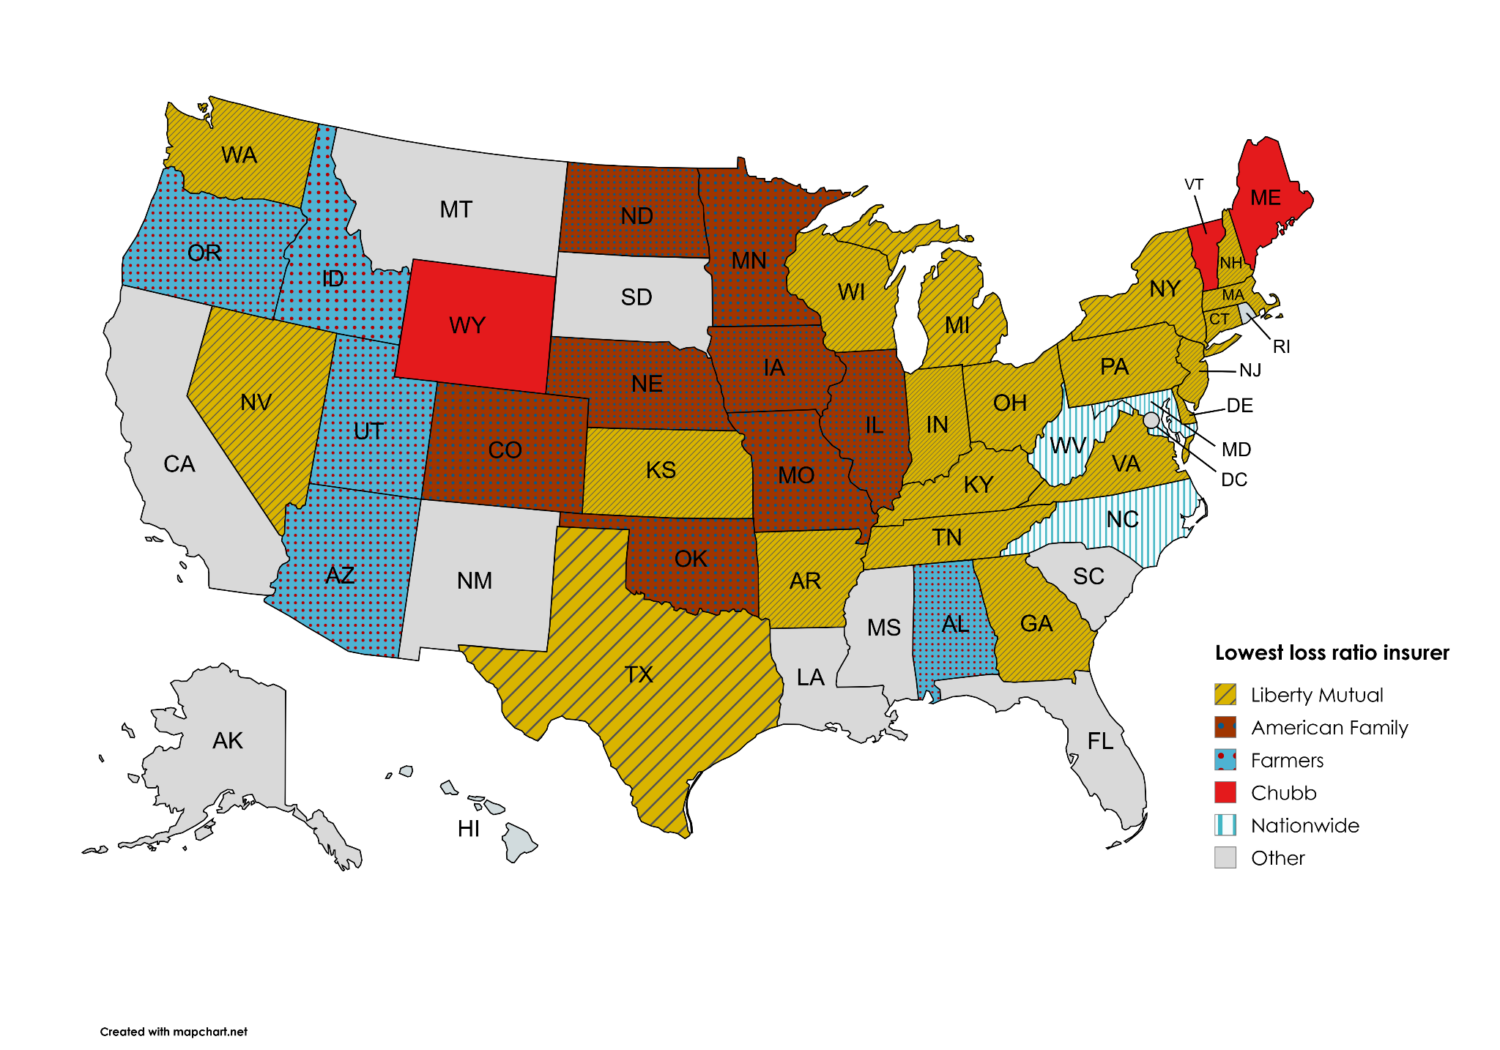
There is a different lowest loss-ratio insurer in each of the highlighted states in our analysis—Texas (Liberty Mutual), Iowa (American Family), Idaho (Farmers), Maine (Chubb), and Florida (Citizens). For each state, recent premium increases have been requested by these insurance carriers and were enacted with little or no objection by insurance commissioners, despite low or declining loss ratios.
Texas
The growing divergence between rising premium revenue and falling claims payouts is readily apparent in Texas. Home insurers increased premiums collected in the state by 78 percent over the past five years, from $11.2 billion in 2021 to $20 billion in 2025. Meanwhile, claims payouts decreased by 23 percent during the same period, from $11.7 billion to $9.1 billion (see Chart 6).
Chart 6. Growing Divergence Between Premiums and Claims Payouts in Texas, 2021-2025
Another way to visualize this pattern is to look at changes in the statewide loss ratio. In Texas, the share of premium revenue used to pay out claims declined by 56 percent, from 104.2 percent in 2021 to 45.5 percent in 2025 (see Chart 7).
Chart 7. Home Insurers Increased Premium Revenue by 78 Percent in Texas as Loss Ratio Fell by 56 Percent from 2021-2025
Of the major insurance companies in Texas, the Liberty Mutual group had the lowest loss ratio in 2025 at just under 30 percent. This came after years of large rate increases that far outpaced inflation and the growth of insured losses from 2021 through 2024.
Our review of recent rate filings uncovered at least nine companies that are part of the Liberty Mutual group that underwrite homeowners insurance lines in Texas. Two of these companies together underwrite over two thirds of Liberty Mutual Group’s home insurance market in the state: American Economy Insurance Company, marketed as Safeco Insurance through April 2026 (NAIC Company Code 19690) and Liberty Mutual Personal Insurance Company (NAIC Company Code 12484).
Rates are regulated by the Texas Department of Insurance under a “file-and-use” process, which allows the insurance commissioner a fixed number of days to review a rate filing and object, otherwise the insurer can implement the rate. American Economy Insurance Company, marketed as “Safeco Insurance” through April 2026, adjusted home insurance rates 12 times over the period with little objection, amounting to a net average 144 percent premium increase since 2021 (see Chart 8). For consumers, this means average premiums are roughly two and a half times average premiums in 2020, so a standard home insurance policy that cost $2,000 in 2020 would have ballooned to $4,969.
Chart 8. Safeco, the Largest Liberty Mutual Group Company in Texas, Filed and Enacted With Little Regulator Objection a Cumulative 144 Percent Increase in Home Insurance Rates from 2021 to 2025
Liberty Mutual Personal Insurance Company meanwhile raised rates seven times over the period with little objection, amounting to a net average 102 percent premium increase since 2021 on homeowners combined dwelling policies, more than doubling their customers’ annual premiums.
From 2021 to 2025, Liberty Mutual group amassed almost six billion dollars in home insurance premiums from Texas homeowners and renters. The firm’s total underwriting income across the state during that period was $2.1 billion. Nearly 70 percent of that came in 2024 and 2025, when loss ratios were 59.2 percent and 30 percent, respectively.
Compared to an environment where rates are set so that losses are 80 percent of the premium, Liberty Mutual generated an estimated $911.5 million in excess underwriting income across Texas between 2021 and 2025 (see Chart 9 and Table 8).
Iowa
Over the past two years, a gap emerged in Iowa between premium revenue, which continued to rise, and claims payouts, which fell (see Chart 10). Home insurers increased premiums collected in the state by 78 percent over the past five years, from $929.2 million in 2021 to $1.7 billion in 2025. Claims payouts decreased by 37 percent during the same period, from $895 million to $559.9 million.
Chart 10. Growing Divergence Between Premiums and Claims Payouts in Iowa, 2021-2025
Another way to visualize this pattern is to look at changes in the statewide loss ratio. In Iowa, the share of premium revenue used to pay out claims declined by 65 percent, from 96.3 percent in 2021 to 33.8 percent in 2025 (see Chart 11).
Chart 11. Home Insurers Increased Premium Revenue by 78 Percent in Iowa as Loss Ratio Fell by 65 Percent from 2021 to 2025
Of the major home insurers in Iowa, the American Family Insurance Company Group had the lowest loss ratio in 2025, at 23.4 percent. As in Texas, this loss ratio came after years of large rate increases that far outpaced inflation from 2021 through 2024.
Two companies together underwrite the bulk of the group’s home insurance market share in the state: American Family Insurance Company (NAIC Company Code 10386) and American Family Insurance Company Mutual Insurance Company Stock Investor (SI) (NAIC Company Code 19275). See here the in-state affiliate homeowners market share.
Rates are regulated by the Iowa Insurance Division under a “use-and-file” process which allows insurers to immediately raise rates upon filing, and allows the insurance commissioner a fixed number of days to review and object. In Iowa, American Family Insurance Company adjusted homeowners rates five times, amounting to a net average 96 percent premium increase since 2021, nearly doubling annual premiums for their customers (see Chart 12).
Chart 12. American Family Insurance Company Filed, and the Regulator Approved, a Cumulative 96 Percent Increase in Home Insurance Rates from 2021 to 2025
American Family Insurance Company Mutual Insurance Company Stock Investor raised rates six times, amounting to a net average 58 percent premium increase since 2021 in aggregate for homeowners, condo owners, and renters. According to the Iowa Insurance Division, the average homeowners insurance premium statewide in 2020 was $998.
The American Family group collected almost $584 million in home insurance premiums from Iowa policyholders between 2021 and 2025. The company’s total statewide underwriting income during that period was $210.9 million. Over 90 percent of that came in 2024 and 2025, when loss ratios were 50.1 percent and 23.4 percent, respectively.
From 2021 to 2025, American Family generated an estimated $94.1 million in excess underwriting income, compared with a scenario in which the company’s statewide loss ratio had been 80 percent each year (see Chart 13 and Table 9).
Chart 13. American Family Made $94 Million in Excess Underwriting Income in Iowa Between 2021 and 2025
Idaho
In Idaho, claims payouts have stagnated as premium revenue continues to rise. Home insurers increased premiums collected in the state by 90 percent over the past five years, from $482.2 million in 2021 to $914.3 million in 2025. During the same period, claims payouts grew by only six percent, from $348 million to $370.6 million (see Chart 14).
Chart 14. Growing Divergence Between Premiums and Claims Payouts in Idaho, 2021-2025
Another way to visualize this pattern is to look at changes in the statewide loss ratio. In Idaho, the share of premium revenue used to pay out claims declined by 44 percent, from 72.2 percent in 2021 to 40.5 percent in 2025 (see Chart 15).
Chart 15. Home Insurers Increased Premium Revenue by 90 Percent in Idaho as Loss Ratio Fell by 44 Percent from 2021 to 2025
Of the major home insurers in Idaho, the Farmers Insurance Group had the lowest loss ratio in 2025 at 27.6 percent.
The major Farmers Insurance Group insurers in Idaho are called Farmers Insurance Company of Idaho (NAIC Company Code 21601) and Farmers Insurance Exchange (NAIC Company Code 21652), which cover the bulk of the group’s market share in the state for home insurance lines and file for rate changes together.
Rates are regulated by the Idaho Department of Insurance under a “use-and-file” process. In Idaho, Farmers Insurance Company of Idaho and Farmers Insurance Exchange adjusted homeowners lines rates seven times without objection, amounting to a net average 66.2 percent premium increase since 2021 (see Chart 16).
Chart 16. Farmers’ Two Largest Companies in Idaho Filed and Enacted Without Regulator Objection a Cumulative 66 Percent Increase in Home Insurance Rates from 2021 to 2025
From 2021 to 2025, Farmers brought in nearly $353 million in home insurance premiums from Idaho homeowners and renters. The firm’s total underwriting income across the state during that period was $165.7 million. More than two-thirds of that was generated in 2024 and 2025, when loss ratios were 41.1 percent and 27.6 percent, respectively.
From 2021 to 2025, Farmers generated an estimated $95.2 million in excess underwriting income, compared with a scenario in which the company’s statewide loss ratio had been 80 percent each year (see Chart 17 and Table 10).
Chart 17. Farmers Made $95 Million in Excess Underwriting Income in Idaho Between 2021 and 2025
Table 10. Farmers Made $95 Million in Excess Underwriting Income in Idaho Between 2021 and 2025
Maine
Although the gap between home insurance premium revenue and claims payouts is not growing as noticeably in Maine as it is elsewhere, it has remained large over the past five years owing to the state’s consistently low loss ratio. Premiums collected in the state increased by 45 percent, from $480.8 million in 2021 to $695.1 million in 2025. During the same period, claims payouts increased by 40 percent, from $158.2 million to $222 million. These factors grew in tandem, but insurers paid out small shares of premium revenue to policyholders each year (see Chart 18).
Chart 18. Consistent Gap Between Premiums and Claims Payouts in Maine, 2021-2025
Another way to visualize this pattern is to look at changes in the statewide loss ratio. In Maine, the share of premium revenue used to pay out claims remained low from 2021 to 2025, averaging 41.2 percent (see Chart 19).
Chart 19. Home Insurers Increased Premium Revenue by 45 Percent in Maine as Loss Ratio Fell by 3 Percent from 2021 to 2025
Of the major home insurers in Maine, Chubb Limited Group had the lowest loss ratio in 2025 at 12.9 percent, significantly lower than that of other major insurers in the state. Within the Chubb group, Great Northern Insurance Company (NAIC Company Code 20303) and Pacific Indemnity Company (NAIC Company Code 20346) write the bulk of Chubb’s home insurance business in the state, and they file for rate increases together with two other companies: Federal Insurance Company (NAIC Company Code 20281) and Vigilant Insurance Company (NAIC Company Code 20397).
Rates are regulated by the Maine Bureau of Insurance under a “file-and-use” process. These four companies adjusted rates three times since 2021, resulting in a cumulative increase of 37.5 percent. The rate changes for Chubb’s affiliates reflect changes to its proprietary Masterpiece homeowners insurance line, its primary offering in Maine, which is primarily marketed to high-end customers (see Chart 20).
Chart 20. Chubb’s Four Largest Companies in Maine Filed, and the Regulator Approved, a Cumulative 38 Percent Increase in Home Insurance Rates from 2021 to 2025
Chubb collected $136.4 million in home insurance premiums from Maine homeowners and renters between 2021 and 2025. The group’s total statewide underwriting income during that period was $104.3 million. Remarkably, its loss ratio never exceeded 32.7 percent.
From 2021 to 2025, Chubb generated an estimated $77 million in excess underwriting income, compared with a scenario in which the company’s statewide loss ratio had been 80 percent each year (see Chart 21 and Table 11).
Chart 21. Chubb Made $77 Million in Excess Underwriting Income in Maine Between 2021 and 2025
Table 11. Chubb Made $77 Million in Excess Underwriting Income in Maine Between 2021 and 2025
Florida
In Florida, home insurance premium revenue and claims payouts have diverged sharply in recent years. Home insurers increased premiums collected in the state by 64 percent over the past five years, from $11.4 billion in 2021 to $18.7 billion in 2025. Claims payouts decreased by 67 percent during the same period, from $6.5 billion to $2.1 billion. Specifically, this gap has grown since 2023 (see Chart 22).
Chart 22. Growing Divergence Between Premiums and Claims Payouts in Florida, 2021-2025
Another way to visualize this pattern is to look at changes in the statewide loss ratio. In Florida, the share of premium revenue used to pay out claims declined by 80 percent, from 56.4 percent in 2021 to 11.4 percent in 2025 (see Chart 23).
No hurricanes made landfall in the U.S. in 2025, which contributed to extremely low loss ratios in the state, though insurers also had low loss ratios in 2024 when the state had high hurricane activity. Nonetheless, the high cost of reinsurance and the risk of especially damaging hurricanes requires insurers to purchase reinsurance to cover severe hurricanes, and may require additional reserves to promote solvency.
Chart 23. Home Insurers Increased Premium Revenue by 64 Percent in Florida as Loss Ratio Fell by 80 Percent from 2021 to 2025
In 2025, Citizens Property Insurance—the state insurer of last resort—was the largest home insurer in Florida, with $1.5 billion in direct premiums written, representing eight percent of the state’s market share. The loss ratio in 2025 dropped significantly to 9.3 percent, from 71.2 percent in 2024, well below levels seen earlier in the decade.
As the insurer of last resort, Citizens files for homeowners’ rate changes with the Florida Office of Insurance Regulation annually. Since 2023 legislation (SB 2-A), Citizens’ rate increases are bound by law to stay below similar private-market rates. Florida statute also caps how much any single policy’s rate can increase in a given year, known as the “glide path”: 12 percent in 2023, 13 percent in 2024, 14 percent in 2025, and 15 percent for 2026 and all subsequent years.
A 2023 Florida law, HB 799, requires that Citizens Property Insurance Corporation policyholders dispute claims in Florida’s Division of Administrative Hearings (DOAH) rather than a circuit court. This process of forced arbitration benefits the insurer; consequently, Citizens won 90 percent of claims disputes, compared with 55 percent in circuit court trials before the law passed. The statute also exposes policyholders to potentially tens of thousands of dollars in attorneys’ fees and restricts their ability to withdraw or appeal claims. The majority of final settlements resulted in measly sums of less than $500. While loss ratios decreased in part due to a more favorable legal environment that made it easier for Citizens to deny claims, Citizens also adjusted homeowners’ rates five times since 2021, with the changes resulting in a cumulative net average rate increase of 30.4 percent (see Chart 24).
Chart 24. Citizens Requested, and Florida Approved, a Cumulative 19 Percent Increase in Home Insurance Rates from 2021 to 2025
From 2021 to 2025, Citizens brought in $10.7 billion in home insurance premiums from Florida homeowners and renters. The carrier’s total underwriting income across the state during that period was $4.3 billion. Roughly 85 percent of that came in 2025 and 2023, thanks to respective annual loss ratios of 9.3 percent and 39.4 percent.
Compared with what would have happened had there been a minimum loss ratio of 80 percent each year, Citizens generated an estimated $2.1 billion in excess underwriting income across Florida between 2021 and 2025 (see Chart 25 and Table 12).
Chart 25. Citizens Property Insurance Made $2.1 Billion in Excess Underwriting Income in Florida Between 2021 and 2025
Part 3: Excess Underwriting Income Could Have Been Used to Fund Climate Adaptation
While curbing property insurance profiteering will bring costs down and provide consumer relief in the short term, climate change will continue to increase the risk of property damage from increasingly severe and frequent disasters for decades to come. The long-term affordability and availability of home insurance depends on climate mitigation, including global efforts to phase out fossil fuels, and climate adaptation, or investments in resilience to better withstand the impacts of climate change.
Adaptation projects at the property level, community level, or landscape scale can protect communities from climate damages and lower risks and insurance costs. The property insurance industry has funded the Insurance Institute for Business & Home Safety (IBHS), which conducts research into cost-effective resilience measures, but has been sluggish to invest in the evidence-based solutions emerging from IBHS unless required to do so by states. The industry could do far more to fund adaptation at scale and to reward property owners for adaptation efforts they undertake, including through premium discounts and continuing coverage.
Even if only a small fraction of the industry’s excess underwriting income was reinvested in communities to support adaptation efforts, it would make an enormous difference in preserving people’s ability to stay insured. Had 10 percent of excess underwriting income been directed towards climate adaptation from 2021 through 2025, it would have provided nearly five billion dollars each year for adaptation projects, far more than FEMA’s annual spending on pre-disaster mitigation.
In a previous section, we estimated that home insurers made nearly $113 billion nationwide in excess underwriting income from 2021 to 2025. That is enough money to fund 11.3 million standard roof fortification matching grants valued at $10,000, providing grants to over a third of the estimated 33.1 million U.S. homes facing moderate or greater hurricane wind risk. Below, we quantify how many specific resilience projects could have been funded by particular companies’ excess underwriting income in Texas, Iowa, Idaho, Maine, and Florida.
Liberty Mutual’s $912 million in excess underwriting income could help protect Western and Gulf Coast Texas.
According to the U.S. Climate Vulnerability Index, Texas faces greater risks from climate impacts than 37 other states. At least 309 census tracts in Texas, home to 3.3 million households, are more vulnerable to climate impacts than 80 percent of the rest of the country. These fall into distinct regions that experience different, but related, climate vulnerability. Over 200 tracts across West Texas are prone to extreme temperatures, drought, and wildfire. Some of the regions in this area are more prone to climate impacts than almost anywhere else in the country, falling into the 99th percentile of vulnerability. The remaining tracts lie along the Gulf Coast and are set to encounter worsening floods and hurricanes. Like West Texas and its heat-amplified disasters, many regions here are in low-lying coastal areas and are more prone to climate impacts than 99 percent of the rest of the country. Some of these tracts include regions in and around some of the state’s largest cities, such as Houston, El Paso, Corpus Christi, and Lubbock.
Between 2021 and 2025, Texas had 37,961 wildfires across over 2.4 million acres. The largest in the state’s history, the Smokehouse Creek Fire, began near the Texas Panhandle, one of these highly climate vulnerable regions, in 2024.In total, the fire burned through 1.05 million acres across Texas and Oklahoma, destroying around 500 buildings and killing two people and more than 15,000 cattle.
Texas was also hit by the second-costliest hurricane in the United States. Hurricane Harvey made landfall in Texas in 2017 along the coast and caused over $125 billion in damage and at least 89 deaths. The top 20 ZIP Codes filing applications for disaster assistance in the storm’s wake lay along the zone that is most vulnerable to climate impacts.
Liberty Mutual, which had the lowest loss ratio of major Texas home insurers in 2025, made an estimated $912 million in excess underwriting income from policyholders in the state between 2021 and 2025. This money could have helped fund major infrastructure projects targeting climate adaptation across the state.
These excess profits could fund more than twice what’s needed for a proposed landmark climate resilience fund, hardening as many as 80,000 homes. In July 2026, Governor Greg Abbott initiated a legislative push to create a $400 million fund that would issue $10,000 grants to single-family homes to retrofit their roofs to meet the FORTIFIED standard set by IBHS. Liberty Mutual’s excess underwriting income alone could fund over twice that amount, replacing roofs on at least 80,000 homes.
All property insurers operating in the state together could generate over 12 times that amount of hazard mitigation. The $11.2 billion in excess underwriting income over the last five years could provide roof fortification grants for 1.12 million households, accounting for more than a third of single-family homes in Texas neighborhoods at the highest level of risk.
American Family’s $94 million in excess underwriting income could help hail-proof Iowa homes.
According to the U.S. Climate Vulnerability Index, Idaho is more vulnerable to climate impacts than 34 other states. At least 48 of the state’s census tracts are in the 80th percentile of climate impact vulnerability, concentrated in central and southern Iowa. These areas, home to nearly 100,000 households and near the state’s major cities, face extreme temperatures and hail-producing storms. Since 2020, Iowa has reported hail over 2,000 times, representing four percent of all the hail reported across the entire country during the same time period.
American Family, which had the lowest loss ratio of major Iowa home insurers in 2025, made an estimated $94 million in excess underwriting income from the state’s policyholders between 2021 and 2025. This sum could help fund climate adaptation grants offered by the state or retrofits for individual homes, such as:
- 1000 $10,000 grants for communities and for-profit businesses to “promote preparedness and resilience.” ($10,000,000) Iowa City offers Community Climate Action Grants of up to $10,000 for nonprofits, community-based organizations, and for-profit businesses to help implement the city’s Climate Action and Adaptation Plan. Eligible projects promote “preparedness and resilience” or “sustainable activities.” While this particular grant program is intended to benefit Iowa City residents, similar programs could be established by other municipalities,.
- Up to 5,600 roof replacements for individual homeowners. ($84,000,000) Some general contractors in the state estimate that a roof replacement with Class 4 impact-resistant shingles, which are ideal for regions that frequently see severe hail, can cost between $15,000 and $22,000.
Altogether, American Family alone could fund thousands of grants and home retrofits for thousands of people across Iowa. All property insurers operating in the state together could generate 3.6 times that amount of hazard mitigation from the $339 million in excess underwriting income generated between 2021 to 2025.
Farmers Insurance’s $95 million in excess underwriting income could help fire-proof Idaho homes and communities.
According to the U.S. Climate Vulnerability Index, Idaho is more vulnerable to climate impacts than 20 other states. At least seven census tracts across the state are in the 80th percentile of climate impact vulnerability, home to over 10,000 households. Many of these tracts are situated in the southern half of the state, which is particularly prone to a combination of extreme heat and wildfires.
In July 2026, the Scorp Fire burned across more than 4,700 acres in Southern Idaho, in a region with a higher wildfire risk than almost anywhere else in the country. Nineteen years prior, in 2007, the second-largest fire in Idaho history scorched 650,000 acres across the southern part of the state as well as parts of Nevada.
A portion of insurers’ excess underwriting income could go toward protecting hundreds of communities and hundreds of thousands of homes from these risks.
Farmers Insurance, which had the lowest loss ratio of major Idaho insurers in 2025, made an estimated $95 million in excess underwriting income from the state’s policyholders between 2021 and 2025. This sum could help fund a variety of Idaho’s climate adaptation grants offered to communities through the state, such as:
- 100 $240,000 grants supporting communities with wildfire resistance plans. ($24,000,000) The Idaho Department of Lands offers Hazard Fuels Reduction (HFR) grants of up to $240,000 to state, county or local agencies, nonprofits, tribes, and educational institutions to pursue fire risk mitigation projects in areas with designated County Wildfire Protection Plans (CWPP) or similar documents. Similarly, the Department of Lands also administers money through the Western States Fire Managers Program. These grants are used to fund the creation of defensible space around homes and structures and to support slash removal, prescribed fires, monitoring, and plan development, AND
- 100 $250,000 grants helping low-income communities improve landscape resilience. ($25,000,000) The Idaho Department of Lands administers the Private Forest Protection, Resilience, and Restoration Assistance (PRRA) Program. State, county, and local agencies, nonprofits, tribes, and educational institutions can receive up to $250,000 to promote resilience and restoration in alignment with Idaho’s State Forest Action Plan in areas that are considered “underserved communities” or low-income by the United States Forest Service AND
- 9,000 $2,500 Firewise Grants for individual landowners and communities to expand wildfire treatment areas. ($22,500,000) Places like Valley County, Idaho, administer grants through the Firewise program to help landowners or communities reduce wildfire risk. The Valley County Wildfire Mitigation Department specifically offers up to $2,500 and expects a 50:50 cost-share AND
- 11,750 $2,000 grants to support wildfire initiatives for up to 176,250 homes. ($23,500,000) Idaho Firewise’s Community Ambassador Partnership Program currently offers reimbursements for hosting a community chipping event, intended to destroy flammable vegetation on privately owned property. Homeowners associations and community organizations are eligible for up to $2,000 per event serving 10-15 residents.
Altogether, Farmers alone could fund grants for thousands of people and communities across Idaho to lower their wildfire risk. All property insurers operating in the state together could generate over seven times that amount of hazard mitigation with their $738 million in excess underwriting income from 2021 to 2025.
Chubb’s $77 million in excess underwriting income could help shore up 7,700 Maine homes.
According to the U.S. Climate Vulnerability Index, Maine ranks higher in climate impact vulnerability than over half of other states in the nation. Thousands of homes across the state experience impacts from severe storms and flooding.
Chubb, which had the lowest loss ratio of major Maine home insurers in 2025, made an estimated $77 million in excess underwriting income from policyholders in the state between 2021 and 2025. This could help fund climate adaptation grants, such as:
- Grants for 7,700 households to upgrade their roofs or mitigate flood risk. Maine has established a climate adaptation program called the Fortify Maine Homes Program, which provides grants for Maine residents to install FORTIFIED roofs—which meet the resilience standards set by the Insurance Institute for Business and Home Safety (IBHS)—or for flood mitigation activities such as retrofitting electrical wiring, sealing ground level openings and foundations, and installing drains. Homeowners can receive $10,000 grants, which can be raised to $15,000 for low-income households.
Chubb alone could fund retrofits for thousands of homes across Maine. All the companies in the state together could generate over 14 times that amount of hazard mitigation with their $1.1 billion in excess underwriting income from 2021 to 2025, and provide Fortify Maine Homes Program grants to 110,000 households, representing about 21 percent of Maine’s single family housing stock.
Citizens’ $2.1 billion in excess underwriting income could shore up Florida homes against hurricanes.
According to the U.S. Climate Vulnerability Index, Florida is more vulnerable to climate impacts than 29 other states. At least 143 census tracts on or near the coast are more vulnerable to climate impacts than at least 80 percent of the rest of the country, representing at least 3.8 million households. One of the biggest threats to homes on Florida’s coasts are climate-intensified hurricanes and flooding, threatening major cities such as Jacksonville, Miami, Tampa, St. Petersburg, Ft. Lauderdale and others.
From 2021 to 2024, Florida had 11 billion-dollar tropical cyclones, 14 billion-dollar storms, and two billion-dollar flood events, according to the National Oceanic and Atmospheric Administration. These cost Floridians up to $306 billion in damages. Hurricane Ian, one of the largest storms in recent U.S. history, made continental landfall in southwestern Florida in 2022. Ian especially endangered the large number of mobile homes in the region; in Lee County alone, over 5,000 mobile homes were destroyed.
Florida Citizens, which had the lowest loss ratio of major Florida home insurers in 2025, made an estimated $2.14 billion in excess underwriting income from Florida home insurance policyholders from 2021 to 2025. This amount would be enough to fund a significant number of climate resiliency grants in the state, such as:
- 211,865 My Safe Florida Homes Grants. ($2,000,000,000) To protect homeowners against hurricane losses, Florida developed and operates a successful climate adaptation program called My Safe Florida Homes, which provides free wind mitigation inspections and matching grants that support qualifying resilience improvements, including stronger roofs, roof-to-wall connections, opening protection, and secondary water barriers. Since 2022, the program has provided matching grants covering up to $10,000 (with cost share requirements eliminated for low-income households) for hurricane retrofits, protecting over 39,000 households at a cost of $369 million dollars. The state is now running a similar pilot program to protect condominiums, offering up to $175,000 per association AND
- All 73 Resilient Florida Planning Grants issued to municipalities in FY2025-26. ($21,344,355) The Florida Department of Environmental Protection also awards planning grants, intended to support projects addressing flooding, sea level rise, and other resiliency efforts across entire communities and regions. Cities and counties can apply for and receive varying funding amounts, according to their needs, projects, and progress. In fiscal year 2025-26, municipalities across the state received $21,344,355 in funding. The largest grant, $1.4 million, went to fund a real-time flood forecasting system for Lee County.
Florida Citizens alone could fund retrofits for hundreds of thousands of homes across Florida. Florida home insurers in aggregate made $20.7 billion in excess underwriting income from 2021 to 2025. This excess underwriting income could fund My Safe Florida Homes grants for an additional 2,068,367 households, representing about 34 percent of Florida’s single family housing stock.
Part 4: Policy Recommendation
As climate change makes disasters more widespread, severe, and costly—and threatens the affordability and availability of property insurance—regulators and policymakers must do a better job of protecting policyholders and communities. State insurance commissioners and legislators should work to prevent growing climate change impacts from being offloaded onto policyholders through rate increases, claims denials, and withdrawals while insurers make record profits. To do so, policymakers should consider prior loss ratios in rate regulation, strengthen oversight of insurer rate increases, require insurers to invest in and reward resilience, increase oversight of insurer claims handling, and increase transparency over insurer underwriting, pricing, and claims decisions.
Consider prior loss ratios in property insurance rate regulation
Federal or state governments should establish a minimum loss ratio (on a direct or net basis) for property insurers, setting a floor on the percentage of collected premiums that must be paid out in claims for insurers to remain in good standing, maintain licenses, and receive consideration for rate filings. Alternatively, insurance commissioners can more closely consider recent loss ratios when evaluating insurance company rate changes, and deny or challenge rate increases by firms with low loss ratios without new legislative action. Because insurance claims fluctuate widely from year to year, policymakers should consider loss ratios averaged over at least five years if establishing a minimum loss ratio or considering loss ratios more centrally in rate regulation. Policymakers may consider existing proposals to establish an 80 percent minimum net loss ratio on P&C insurers as a whole or establish a minimum loss ratio on specific insurance lines (i.e. home, auto, etc.). If established on the state level, policymakers should consider the appropriate loss ratio floor for their state based on risk and current market factors. Establishing a minimum loss ratio will discourage excessive spending on advertising, dividends, fighting claims, and other non-essential costs, and promote claims payments above current levels. Insurance regulators can also cap these expenses outright rather than relying on a minimum loss ratio alone or prohibit expenses from being passed through to policyholders as rate increases.
Strengthen oversight of insurer rate increases and excess spending
State insurance commissioners should increase their scrutiny of insurer rate increases and excess spending. In states where the insurance commissioner has the authority to approve or deny rate increases before they go into effect, insurance commissioners should use this authority to closely review and analyze profit margins, administrative costs, and investment income and deny excessive rate requests. When insurance companies have consecutive years of outsized profits, they should be required to either lower their rates or submit a justification for maintaining their current rates. Insurance commissioners should also scrutinize or outright cap excess spending that may not appear as profit, such as excessive executive compensation, spending on corporate jets, and excessive dividends and share buybacks, as well as methods used to funnel profits to affiliates, like purposefully overpaying for reinsurance. States that do not currently grant their insurance commissioner prior approval authority over rates should pass laws to do so, and provide avenues for meaningful public participation in the rate review process.
Require insurers to invest in and reward resilience
States should incentivize investments in climate resilience by providing grant funding to homeowners for resilience upgrades. Ten states and counting have established grant programs to help homeowners make resilience upgrades to their property, including fortified roofs, wildfire mitigation, and flood mitigation. Many of these grant programs are modeled off the Strengthen Alabama Homes Program, through which owners of existing owner-occupied single-family homes in certain counties in Alabama are eligible for a grant up to $10,000 for a roof upgrade meeting the IBHS FORTIFIED Roof standard. In addition to funding property-level resilience projects, states should identify opportunities for insurers to pay into community- and landscape-scale resilience projects that can lower risks for insurers and communities alike.
Funding for the Alabama program and several other state programs comes from fees or premium taxes on the insurance industry. States should increase fees or premium taxes on insurers operating in the state to fund grant programs that can save homeowners, property owners, insurers, and state governments money following disasters. State insurance regulators should require insurers to give homeowners discounts for upgrades that protect against disasters. They should also require insurers to account for home and community improvements that reduce wildfire and other catastrophe risks in both underwriting and pricing, much as Colorado did in 2025 enacting a bill entitled Risk Model Use In Property Insurance Policies. Insurers should also be required by states to take some portion of their investment returns and make funds available to policyholders to fortify their homes. While many existing grant programs are capped at $10,000 per recipient, states should consider larger grant amounts for low- and moderate-income homeowners to incentivize uptake from those with the most financial need.
Increase oversight of insurer claims handling
Insurance departments should increase oversight of insurer claims handling practices to ensure that policyholders receive the benefits of the insurance they pay for in the event of a disaster. When claims go unpaid, households are too often left to cover repair and rebuilding expenses themselves, despite having paid for insurance. Given the high rate of unpaid claims, insurance departments must increase oversight of insurer claims practices to ensure that policyholders are fairly paid. When insurance department oversight is insufficient, states should consider legal action against insurers. For example, the Oklahoma attorney general has recently sued State Farm and Allstate over an alleged scheme to systematically underpay claims.
Increase transparency over insurer underwriting, pricing, and claims decisions
State insurance departments should maintain a public webpage to describe how the insurance rate-setting process works in plain language, and maintain a public schedule of hearings relating to rate-setting and methods for consumers to participate in the process. Insurance departments should also make public the full rate manual for each home insurance carrier operating in the state, and require insurers to file their full up-to-date rate manual with every rate filing, so insurance departments and the public can better understand pricing decisions. In the event an insurer would like to nonrenew a policy, they should be required to disclose to the policyholder the reason for nonrenewal in writing and the remedies the policyholder could take to stay insured by their current provider. States should extend nonrenewal notice periods to at least 90 days to provide sufficient time for policyholders to make upgrades to their property to stay insured.
Insurance commissioners should also seek to provide consumers with data that allow them to meaningfully compare different insurance companies along the key dimensions that consumers care about, including their claims handling track record and how well their prices reflect the value these companies return to policyholders. Insurance consumers should not need to be experts to understand why their rates are going up or how their rate increases compare to others’ across the state.
Accordingly, each state should create a searchable online database covering each individual insurer in the state, disaggregated for each homeowners insurance line, that includes total aggregate statewide increases in premium, average gross annual premiums per policy, loss ratios, and claims handling statistics. This database should cover at least the last five years and include any additional names the insurer uses across branding and rate filings.
Appendix A: National Statistics and Loss Ratio Methodology and Rationale
Every year, the National Association of Insurance Commissioners (NAIC) publishes data on loss ratios across states, companies, and lines of business in its market share reports.
Our methodology uses direct loss ratios, which exclude reinsurance costs and payouts, to evaluate whether insurance companies are charging too much for premiums. This ratio measures the percentage of premiums insurers pay out in claims, revealing how much premium revenue remains for other expenses and profits. Direct loss ratios are the best measure for the value consumers are getting. A lower loss ratio means a smaller share of the premiums collected returns to policyholders through claims payouts, which ultimately reflects the efficiency of the sector in returning capital back to policyholders, the main purpose of insurance.
The money that does not go toward claims supports expenses, including advertising campaigns built around the familiar jingles and mascots of major insurers, reinsurance, legal costs associated with denying policyholders’ claims, and other overhead. Companies also direct substantial sums toward dividends, stock buybacks, and executive compensation, alongside costly perks such as State Farm’s four private jets.
Our methodology applies an 80 percent loss ratio benchmark as the basis for evaluating how much premium revenue insurers pocket as excess profits rather than pay out in claims. We use an 80 percent loss ratio benchmark because the objective is not simply to identify unusually low ratios, but to establish a meaningful standard for ensuring that policyholders receive value for their premiums. This threshold is comparable to the federal minimum loss ratio requirements for health insurers, which require insurers to spend at least 80 percent of premium revenue on health care claims. The major difference between P&C insurance and health insurance is that major loss events can cause greater year-to-year variability in P&C loss ratios, making that higher benchmark harder to meet annually. But, in recent years, P&C insurers’ use of reinsurance has helped mitigate this variability, with net loss ratios remaining more consistent year-to-year. Historically, P&C insurers have had higher loss ratios, averaging around 74 percent in the 1990s, not far off from an 80 percent benchmark.
Even with a benchmark for loss ratios, the metric is not immune from being manipulated to represent inflated losses. Net loss ratios are calculated including reinsurance costs, which create issues of non-competitive profits earned by reinsurers and the skimming of premiums by some insurers to affiliated reinsurers as well as other affiliated business arrangements for other parts of the insurance life cycle. Without clear definitions of “losses” in the ratio, insurers could inflate reported losses by classifying ordinary overhead, legal fees, and administrative costs as loss-adjustment expenses. This is particularly murky because insurers may own affiliates that handle claims or provide reinsurance. By inflating payments to these affiliates, insurers can manipulate direct or net loss ratios while shifting profits to related companies. This has occurred in both California, where State Farm overpaid for reinsurance, and Florida, where insurers have repeatedly overpaid affiliated companies for administrative services.
Loss ratios are not a one-to-one measure of whether insurers are shortchanging policyholders on claims payments. They are rough measures, and the way insurers classify costs and calculate these numbers can make it hard to see where the money actually goes. These limitations do not negate the value of loss ratios as a tool for understanding insurer profitability and assessing how much premium revenue insurers retain rather than pay out in claims. They can be a useful starting point to scrutinize the excess costs insurers use to obscure money flowing to executives, affiliated companies, and excessive marketing—costs ultimately borne by policyholders.
Appendix B: Rate Filings
A major goal of insurance reform should be to provide the public with accessible, generally comprehensible data that allows them to meaningfully compare different insurance companies along the key dimensions that consumers care about: their claims handling track record and how well their prices reflect the value these companies return to policyholders. Insurance consumers should not need to be experts to understand why their rates are going up, or how their increases compare to others’ across the state.
In general, it can be difficult for consumers, researchers, and policymakers to fully understand the property insurance rate filing process, the actuarial data underpinning rate hikes, why rates are rising so quickly and for whom, and how the financial health of individual insurers and their parent companies factor into the process.
The public is generally familiar with the names of major insurance groups—the parent companies that advertise during the Super Bowl—but these insurance groups often own handfuls of state-level subsidiaries and affiliates, some with recognizable names, but others which can appear totally unrelated. Some companies file rates under different names than their brand name, so the first challenge for a consumer trying to understand their rate hike is finding out the actual name of their insurer as filed with the state insurance regulator.
If the state insurance department website provides a link to the NAIC’s SERFF database, the consumer might find their way to a specific webpage where they can search rate filings in their state, though even this link is sometimes hard to find. From there, rate filings’ documents and criteria are handled differently in each state, resulting in non-standardized sets of forms and actuarial exhibits. Companies sometimes file for rate increases for all homeowners’ insurance lines simultaneously and sometimes for just a subset (e.g., only renters insurance). The percentage for statewide average premium increase attributed to an individual rate filing are sometimes rolled up to an aggregate number that covers all homeowners lines (HO-1 through HO-8), while sometimes these percentages are listed just for a particular line. We attempted to compile rate filings for individual companies and document our methodology below, which differs slightly state to state given the different availability of comprehensible information and variable business structures.
Qualitatively, it is clear upon reviewing forms in a variety of states that different state insurance regulators subject rate filings to variable levels of scrutiny, allowing for different levels of projected underwriting profits, approving hikes at different speeds, asking more or fewer questions of insurers to justify their requests, and providing different levels of transparency for the public. Some of these state-level discrepancies are due to statutory differences, but some appear to be due to the inclinations of different insurance commissioners themselves and the capacity of their departments.
Across companies and states, insurers usually claim their models suggest they need larger rate increases than those they actually file for (often denoted as “indicated” vs “selected” increases, respectively), despite the general trend we document in this report of decreasing loss ratios from 2021 to 2025 in each of these states. Departments of Insurance sometimes request more information and companies respond with more data and explanations. Back and forth negotiations, revealed in sequential documentation, between regulators and insurers are often more subjective than is commonly understood by the public and researchers and can be difficult to track across filings. Insurers very rarely formally adjusted or withdrew rate filings in the states we reviewed. Some states also do not clearly indicate whether a filing was approved and went into effect: For example, Texas tags filings in effect as “closed.”
From a consumer’s perspective, despite this nominal public access to NAIC’s SERFF rate filing database, it would be extremely difficult and time consuming—and sometimes impossible—to really understand why their rates are rising and how these increases compare to aggregate increases in the state or the rate hikes of other individual insurers. Different companies—even within the same insurance group—raise rates at quite different speeds, and consumers might have been pushed towards one subsidiary over another when they applied for coverage, not knowing the price would diverge later.
The result of this tangle of data, existing in different locations and filed under different company names in different formats, is generally inscrutability. This limits the ability of the public to understand why rates are rising and to compare different companies. The Texas Department of Insurance maintains the most useful database we have seen to make rate filings more discernible, but cross referencing between its database and SERFF would still be necessary to understand, for example, which homeowners lines are covered under a particular filing and what parts of the rating manual are changing.
Rate filing review methodology
We chose to review only homeowners multiperil owner-occupied policy lines (see here for descriptions), which do not comprise the entirety of the residential property insurance market. Flood, earthquake, force-placed, and dwelling fire (for rental properties, investment homes, or vacant dwellings where the owner does not primarily reside) are covered under different policies that the NAIC aggregates in separate sections of its market share reports.
Generally, we reviewed rate filings using the NAIC SERFF database along with materials provided by state departments of insurance where available. Approximate state-wide market share in homeowners lines were established by reviewing all recent rate filings dating back to 2020 for all companies within the insurance groups in question within a state as identified in the NAIC’s 2025 market share report. We looked for the most recent mention of overall premiums written, usually available in a 2025 or 2026 rate filing. From there, we selected the large home insurance company or companies (by home insurance premium volume) operating in the state to review rate filings to determine the net impact on average statewide premiums for homeowners insurance lines from 2020 through present, and in the case of Texas, the average statewide premium increase for a hypothetical standard policy.
Texas
Texas rate filings were reviewed using the NAIC SERFF Texas database as well as the Texas Department of Insurance’s rate database and search tool. Where observed rate changes were available, we used those figures, and where not, we used the projected filed rate changes. Tables 13 and 14 below include the full range of rate filings we considered in Texas for the two Liberty Mutual group companies with the largest home insurance market share in Texas.
Table 13. American Economy Insurance Company, marketed as Safeco Insurance through April 2026, (NAIC Company Code: 19690) homeowners increases in Texas since 2021. This company is the largest Liberty Mutual group company in Texas in the homeowners insurance lines.
These rate changes were also confirmed retroactively by the company in Exhibit C in SERFF filing LBPM-134946965. This table includes rate changes in aggregate across all homeowners insurance lines (HO-1 through HO-8 policies), excluding two filings that only covered condo owner insurance rate increases.
| Year | SERFF Filing | Effective date (renewal) | Rate change observed | Net rate change since 1/1/2021 | Annual direct loss ratio (group-wide) |
| 2021 | LBPM-132670957 | 7/9/21 | 8.6% | 8.6% | 113.5% |
| 2022 | LBPM-133173240 | 7/9/22 | 11.0% | 20.5% | 65.8% |
| LBPM-133308612 | 9/12/22 | 10.2% | 32.8% | ||
| 2023 | LBPM-133525314 | 7/9/23 | 12.0% | 48.8% | 74.0% |
| LBPM-133632424 | 9/12/23 | 12.0% | 66.6% | ||
| LBPM-133789752 | 12/27/23 | 8.1% | 80.1% | ||
| 2024 | LBPM-133872665 | 2/20/24 | 11.0% | 99.9% | 59.2% |
| LBPM-133929149 | 4/24/24 | 3.0% | 105.9% | ||
| LBPM-134032580 | 7/9/24 | 16.2% | 139.3% | ||
| LBPM-134118460 | 9/12/24 | 4.2% | 149.4% | ||
| 2025 | LBPM-134646377 | 11/25/25 | -2.0% | 144.4% | 30.0% |
| 2026 | LBPM-134946965 | 9/12/26 | 1.7% | 148.5% |
Table 14. Liberty Mutual Personal Insurance Company (NAIC Company Code: 12484) homeowners combined dwelling rate increases in Texas since 2021.
This company is the second largest Liberty mutual group affiliate in Texas in the homeowners insurance lines. These rate changes were also confirmed retroactively by the company in Exhibit C in SERFF filing LBPM-134968726. This table includes rate changes in aggregate across all homeowners combined dwelling policies.
| Year | SERFF Filing | Effective date (renewal) | Rate change filed | Net rate change since 1/1/2021 | Annual direct loss ratio (group-wide) |
| 2021 | LBPM-132578103 | 03/20/21 | 6.4% | 6.4% | 113.5% |
| 2022 | LBPM-133138341 | 03/20/22 | 9.0% | 16.0% | 65.8% |
| LBPM-133336805 | 08/30/22 | 11.0% | 28.7% | ||
| 2023 | LBPM-133447540 | 03/20/23 | 9.0% | 40.3% | 74.0% |
| LBPM-133752064 | 08/30/23 | 21.0% | 69.8% | ||
| 2024 | LBPM-133926067 | 03/20/24 | 17.0% | 98.7% | 59.2% |
| 2025 | No rate changes | 98.7% | 30.0% | ||
| 2026 | LBPM-134968726 | 08/30/26 | 1.8% | 102.2% |
Iowa
Iowa rate filings were reviewed using the NAIC SERFF Iowa database. The rate filings in Table 18 and 19 reflect all filings for the two largest American Family Group companies that had a net impact on their respective average statewide premiums for homeowners insurance lines (excluding renters, condo, and manufactured homeowners policies). Net rate changes for Table 18 were listed based on retrospective observed rate changes (as shown in SERFF filing AMFC-134576714 “Actuarial Memorandum Exhibit”) which differ slightly from the filed rate changes.
Table 15. American Family Insurance Company (NAIC Company Code: 10386) homeowners insurance premium increases in Iowa since 2021.
These rate changes were also confirmed retroactively by the company in the Actuarial Memorandum Exhibit in SERFF filing AMFC-134576714. These rate changes reflect filed increases for homeowners insurance policies only, excluding renters, condo owners, and manufactured homeowners lines.
| Year | SERFF Filing | Effective date (renewal) | Rate change observed | Net rate change since 1/1/2021 | Annual direct loss ratio (group-wide) |
| 2021 | AMFC-132958514 | 10/15/21 | 8.0% | 8.0% | 96.9% |
| 2022 | AMFC-133384114 | 11/1/22 | 15.1% | 24.3% | 84.5% |
| 2023 | AMFC-133784750 | 11/1/23 | 22.0% | 51.7% | 96.9% |
| 2024 | AMFC-134172411 | 11/1/24 | 30.5% | 97.9% | 50.1% |
| 2025 | AMFC-134576714 | 11/1/25 | -0.9% | 96.1% | 23.4% |
| 2026 | None | 96.1% |
Table 16. American Family Insurance Company Mutual Insurance Company Stock Investor (SI) (NAIC Company Code: 19275) homeowners insurance premium increases in Iowa since 2021.
These filings cover aggregate rate changes in the homeowners insurance lines, covering multiple homeowners insurance products ( “Goldstar,” which is the primary homeowners product, and “Custom Value and Forms 1, 2, 3”) and renters and condo owners policies.
| Year | SERFF Filing | Effective date (renewal) | Rate change indicated in filing | Net rate change since 1/1/21 | Annual direct loss ratio (group-wide) |
| 2021 | AMFC-132880466 | 9/1/21 | 4.5% | 4.5% | 96.9% |
| 2022 | AMFC-133318285 | 9/1/22 | 11.0% | 16.0% | 84.5% |
| 2023 | AMFC-133733050 | 9/1/23 | 11.0% | 28.8% | 96.9% |
| 2024 | AMFC-133949224 | 4/7/24 | 14.8% | 47.8% | 50.1% |
| 2024 | AMFC-134171104 | 11/15/24 | 5.0% | 55.2% | |
| 2025 | AMFC-134528517 | 9/1/25 | 1.8% | 58.0% | 23.4% |
| 2026 | None requested | 58.0% |
Idaho
Idaho rate filings were reviewed using the NAIC SERFF Idaho database. The rate filings in Table 17 reflect aggregate changes across all homeowners lines (HO-1 through HO-8) for the two companies which file for rate changes together, and which offer multiple homeowners products.
Table 17. Farmers Insurance Company of Idaho (NAIC Company Code: 21601) and Farmers Insurance Exchange (NAIC Company Code: 21652) homeowners insurance rate increases in Idaho since 2021.
These two companies together make up the bulk of Farmers Insurance group’s homeowners insurance business in Idaho. Rate changes listed represent filed aggregate changes for all homeowners insurance lines offered by these carriers, including the Farmers Flex Personal Home policy, Farmers Smart Plan Home policy, and Farmers Smart Plan Condo policy, as well as other homeowners, condo owners, and renters policies.
| Year | SERFF Filing | Effective date (renewal) | Rate change filed | Net rate change since 1/1/2021 | Annual direct homeowners loss ratio (group-wide) |
| 2021 | FARM-132760220 | 3/21/21 | 0.9% | 0.9% | 74.1% |
| 2022 | FARM-133196952 | 3/20/22 | 4.6% | 5.5% | 76.5% |
| 2023 | FARM-133707765 | 5/18/23 | 7.6% | 13.6% | 63.4% |
| FARM-133908565 | 11/21/23 | 21.9% | 38.4% | ||
| FARM-133929727 | 12/16/23 | 3.7% | 43.6% | ||
| 2024 | FARM-134133836 | 5/18/24 | 13.5% | 62.9% | 41.1% |
| 2025 | FARM-134715193 | 12/13/25 | 2.0% | 66.2% | 27.6% |
| 2026 | None requested |
Maine
Chubb rate filings were reviewed using the NAIC SERFF Maine database. Chubb affiliates filed rate increases jointly, so the analysis reflects their combined rate changes. Chubb offers its premier personal insurance program for higher-value homes in Maine called “Masterpiece.” The homeowners coverage is on the company’s own proprietary form with extras like extended replacement cost and water backup included as standard.
Table 18. Federal Insurance Company (20281), Great Northern Insurance Company (20303), Pacific Indemnity Company (20346), and Vigilant Insurance Company (20397) aggregate rate increases for the “Masterpiece” homeowners insurance product line in Maine since 2021, including Form/Coverages including “House/Vacation Home”, “R/C/C” and “Home Primary Liability.”
| Year | SERFF Filing | Approval or effective date (renewal) | Rate change filed | Net rate change since 1/1/2021 | Annual direct loss ratio (group-wide) |
| 2021 | ACEH-132542849 | Approval date: 11/12/2020; Effective date: likely early 2021 | 10.2% | 10.2% | 25.9% |
| 2022 | None requested | 10.2% | 24.1% | ||
| 2023 | ACEH-133436862 | Approval date: 12/9/2022; Effective date: likely early 2023 | 15.1% | 26.8% | 32.7% |
| 2024 | None requested | 26.8% | 24.8% | ||
| 2025 | ACEH-134296896 | Effective date: 4/3/25 | 8.4% | 37.5% | 12.5% |
| 2026 | ACEH-134893235 | Approval date: 6/9/26 | 2.4% | 40.8% |
Florida
Florida’s Citizens Property Insurance Corporation is the state insurer of last resort, and therefore its rates are subject to greater statutory limits and regulatory oversight. Citizens has statutory rate increase caps, which for 2026 limit rate increases to 15% for primary-residence personal policies. The rate changes reflected in Table 19 are for the established rates for HO-3, HO-4, and HO-6 policies, multiperil personal lines for single-family homeowners, renters, and condo owners, excluding high-risk coastal account policies. In 2024, coastal accounts made up less than 10% of the company’s multiperil homeowners lines business. Florida Citizens rate increases are listed separately for personal and commercial lines. Rate increases for Citizens also involve a more public process, including public hearings and opportunities for public comment.
Table 19. Citizens Property Insurance homeowners insurance rate increases in Florida since 2021 for personal HO-3, HO-4, and HO-6 policies, excluding high-risk coastal account policies.
| Year | OIR Case No. | Effective date (renewal) | Established net rate change | Net rate change since 1/1/21 | Annual direct loss ratio (across all lines) |
| 2021 | 279215-21 | 8/1/21 | 3.2% | 3.2% | 44.8% |
| 2022 | 293112-22 | 9/1/22 | 6.4% | 9.8% | 144.4% |
| 2023 | 314719-23 | 11/1/23 | 11.3% | 22.2% | 39.9% |
| 2024 | No Rate Change | ||||
| 2025 | 030310-24 | 6/1/25 | 6.6% | 30.4% | 71.2% |
| 2026 | 056573-25 | 6/1/26 | -8.8% | 18.8% |
Sources
- Hancock, Peter. “Insurance Industry Opposes Regulation, Blames Inflation and Climate Change for Rate Hikes.” Capitol News Illinois. August 21, 2025.
- Ge, Shan et al. “Climate Risk, Insurance Premiums, and the Effects on Mortgage and Credit Outcomes.” Federal Reserve Bank of Dallas. January 2025.
- Roston, Eric. “Home Insurance Tops Property Taxes in Squeeze For US Households.” Bloomberg. October 20, 2026.
- Sastry, Parinitha et al. “The Limits of Insurance Demand and the Growing Protection Gap.” Harvard Business School. May 2025.
- Gunara, Maggie and Becca Stanek. “Nearly 1 in 7 Homes Across US Are Uninsured.” Lending Tree. March 2, 2026.
- National Association of Insurance Commissioners. “2025 Market Share Reports For Property/Casualty Groups and Companies by State and Countrywide.” August 2026.
- AM Best. “Best’s Market Segment Report: A Myriad of Factors Lead to Markedly Improved Homeowners Results.” September 28, 2026.
- Horton, Cassidy. “https://www.realtor.com/news/trends/home-insurance-crisis-nonrenewal-rates/.” Realtor.com. August 18, 2026.
- Sisler, Tonya. “Experts say climate change is impacting home insurance: Do homeowners see it?” KIRO 7 News. October 28, 2026.
- Bogage, Jacob. “Home insurers cut natural disasters from policies over climate risk.” The Washington Post. September 3, 2023.
- Shearer, Brian. “How to Lower the Insurance “Tax” By $150 Billion.” Vanderbilt University. Vanderbilt Policy Accelerator. April 2026.
- Humphrey, Justin et al. “Federal Spending for Flood Adaptations.” Congressional Budget Office. September 2024.
- Riddle, Anne. “Funding for Wildfire Management: FY2025 Appropriations for Forest Service and Department of the Interior.” Congressional Review Service. September 12, 2025.
- Stancil, Kenny. “Mapping Home Insurance Regulation.” Revolving Door Project. March 17, 2026.
- Riley Roche, Lisa. “What is the state of housing in Utah?” Deseret News. September 9, 2026.
- AON. “2026 Climate and Catastrophe Insight.” 2026.
- AON. “Climate and Catastrophe Insight.” 2025.
- Verisk. “U.S. P&C Insurers Post Strong Underwriting Gains Through First Half of 2026; Line-Specific and Geographic Challenges Persist.” September 2, 2026.
- Brannon, Matt et al. “Insurify Projects Home Insurance Rates Will Rise for the 5th Consecutive Year, After a 12% Increase in 2025.” Insurify. 2026.
- Flavelle, Christopher. “Insurers Are Dropping Homeowners as Climate Shocks Worsen.” The New York Times. December 18, 2024.
- Eaglesham, Jean and Jaclyn Jeffrey-Wilensky. “The Home-Insurance Coin Flip: Nearly Half of Claims Result in Zero Payout.” The Wall Street Journal. May 30, 2026.
- Black, Sam and Sydney Guthrie. “We Uncovered Where Your Insurance Payments Are Really Going.” More Perfect Union. August 14, 2026.
- Goldstein, Jacob. “Warren Buffett Explains The Genius Of The Float.” NPR. Planet Money. March 1, 2010.
- Sclafane, Susanne. “What Progressive and GEICO Q3 Results Reveal About Auto Insurance Profit, Growth.” Insurance Journal. November 10, 2025.
- Shearer, Brian. “Property Insurance Has a Greedflation Problem.” Vanderbilt University. Vanderbilt Policy Accelerator. April 30, 2026.
- Delong, Michael and Douglas Heller. “Top Ten Insurance CEOs Earned Over $155 Million in Compensation in 2025, While Consumers Struggled to Pay Premiums.” Consumer Federation of America. October 20, 2026.
- Shearer, Brian. “Regulating Insurance as a Public Utility.” Vanderbilt University. Vanderbilt Policy Accelerator. April 2026.
- “Medical loss ratio.” Centers for Medicare and Medicaid Services. Accessed November 2026.
- Carlson, Debbie. “HO-1 to HO-8: Comparing home insurance policy types.” Britannica Money. Accessed November 2026.
- Heller, Douglas and Michael Delong. “New Analysis: Homeowners Insurance Companies Earn Millions in Interest and Investment Income with Every Day of Claim Delay.” Consumer Federation of America. July 30, 2026.
- Keller, Yana. “Liberty Mutual retires Safeco brand, unifies personal insurance products.” Beinsure. October 28, 2026.
- Grubbs, Spencer and Kelly Langford. “Home insurance premiums complicate housing affordability.” Fiscal Notes. October 2024.
- Sellmeyer, Sonya. “Consumer Connection: Shopping for Homeowners Insurance.” Iowa Insurance Division. July 24, 2023.
- Ocean Point Claims Company. “Florida Statute 627.351: Citizens Property Insurance Corporation, FAQ.” Accessed November 2026.
- Ariza, Mario. “A Florida Home Insurer Was Allowed to Bypass the Courts During Claim Disputes. It Won More Than 90% of the Time.” ProPublica. September 15, 2025.
- Cotality. “Hurricane risk 2025: Outpriced and underwater.” May 29, 2025.
- Environmental Defense Fund, Texas A&M University, and Darkhorse Visualization. “The U.S. Climate Vulnerability Index.” Accessed November 2026.
- Texas A&M Forest Service. “Historical Fire Statistics.” Accessed November 2026.
- OroraTech. “2 Years After Smokehouse Creek Fire: What we Learned.” 2026.
- Fiscal Notes. “A Storm to Remember: Hurricane Harvey and the Texas Economy.” Accessed November 2026.
- Texas Division of Emergency Management. “HURRICANE HARVEY DR 4332.” Accessed November 2026.
- National Oceanographic and Atmospheric Administration. “Hurricane Harvey: A Look Back Seven Years Later.” August 26, 2024.
- Pope, Jacob. “Gov. Abbott’s $400M Roof Fortification Plan — What Texas Homeowners Need to Know.” Donegan. July 21, 2026.
- Plain Hazard. “Iowa hail.” Accessed November 2026.
- Iowa City. “Climate Action Grants.” Accessed November 2026.
- Yates, Chad. “Iowa Roof Replacement Cost in 2026: What Homeowners Actually Pay.” Buckshot General Contracting. Updated October 2026.
- CBS 2 Idaho. “Scorp Fire burning thousands of acres near Murphy, Idaho.” July 26, 2026.
- Wildfire Risk to Communities. “Murphy has a very high risk of wildfire—higher than 98% of communities in the US.” US Department of Agriculture and US Forest Service. Accessed November 2026.
- Launchbaugh, Karen et al. “Interactions among livestock grazing, vegetation type, and fire behavior in the Murphy Wildland Fire Complex in Idaho and Nevada, July 2007.” US Geological Survey. September 7, 2008.
- Idaho Department of Lands. “Hazard Fuels Reduction Grants.” Accessed November 2026.
- Idaho Department of Lands. “FY26 HFR, FY27 WSFM Grant Programs Request for Proposals.” 2026.
- Idaho Department of Lands. “Private Forest Protection, Resilience, and Restoration Assistance.” Accessed November 2026.
- Valley County Idaho. “Building a Fire-Resilient Valley County.” Accessed November 2026.
- Idaho Firewise. “Community Ambassador Partnership.” Accessed November 2026.
- Maine Bureau of Insurance. “Fortify Maine Homes Program.” Accessed November 2026.
- Fortified 2025. “FORTIFIED Roof™.” Insurance Institute for Business and Home Safety. Accessed November 2026.
- National Oceanographic and Atmospheric Administration. National Center for Environmental Information. “Florida Summary.” Accessed November 2026.
- Widdekind, Andrew. “Financial & Population Damage Impacts from Hurricane Ian.” December 12, 2022.
- Olander, L. et al. “FORTIFIED Roof Case Study: Florida.” Duke University. Nicholas Institute for Energy, Environment, and Sustainability. 2026.
- Florida Department of Environmental Protection. “Exhibit A Progress Report Form – Planning Grants.” Accessed November 2026.
- Florida Department of Environmental Protection. “Fiscal Year 2025-26 Resilient Florida Planning Projects.” Accessed November 2026.
- Americans for Financial Reform Education Fund. “States Must Strengthen Oversight of Homeowners Insurance Rate Increases.” February 28, 2026.
- Stancil, Kenny and Dan Wagner. “Home Insurance Executives Are Raking It In—at Your Expense.” The American Prospect. July 23, 2025.
- Darmiento, Laurence. “State Farm accused of funneling excess profits to parent as it seeks rate hike.” LA Times. October 28, 2024.
- Schupak, Elyse and Carly Fabian. “Principles for Resilient Homes Grant Programs.” Public Citizen. June 9, 2026.
- Alabama Department of Insurance. “Strengthen Alabama Homes Application Portal.” Accessed November 2026.
- Colorado General Assembly. “HB25:1182 Risk Model Use in Property Insurance Policies.” 2025.
- Oklahoma Office of Attorney General. “Drummond files lawsuit against Allstate Insurance Company.” July 7, 2026.
- Rosenfeld, Harvey. “Why Minimum Loss Ratios Don’t Work For Home Insurance.” Consumer Watchdog. September 15, 2026.
- Balber, Carmen. “State Farm’s Shady Reinsurance Deal.” Consumer Watchdog. November 8, 2024.
- Swisher, Skyler et al. “News organizations publish Florida’s secret examination of insurer profits.” Orlando Sentinel. September 26, 2026.
- National Association of Insurance Commissioners. “SERFF Filing Access for Texas.” Accessed November 2026.
- National Association of Insurance Commissioners. “Dwelling Fire, Homeowners Owner-Occupied, and Homeowners Tenant and Condominium/Cooperative Unit Owner’s Insurance Report: Data for 2023.” July 2026.
- Florida Office of Insurance Regulation. “CITIZENS FILING FCP 24-030311 – COASTAL ACCOUNT – HOMEOWNERS STATEWIDE PROPOSED CHANGES BY POLICY TYPE.” Accessed November 2026.
Photo: An aerial view of damage from the Palisades Fire in Los Angeles County, California. Taken in January 2025 by the California National Guard and licensed under CC BY 2.0.