
Households across the United States face a new and unexpected cost from fossil fuel-driven climate change: Skyrocketing home insurance premiums, along with policy nonrenewals and cancellations. Increasingly frequent and intense extreme weather is boosting insured catastrophe losses. The insurance industry, unprepared despite knowing about climate change for decades, is scrambling to shift those costs to the public. Without intervention, the household impacts could trigger a financial crisis, with rising insurance costs and foreclosures undermining local tax bases, regional financial institutions, and the mortgage market.
Map 1. ZIP Code-Level Data
This interactive map, built using data released by Treasury’s Federal Insurance Office, reveals the widespread nature of the U.S. home insurance crisis according to seven metrics of insurance availability and affordability. Use the drop-down menu to see 1) nonrenewal rates, 2) nonpayment cancellation rates, 3) other cancellation rates, 4) claim frequency rates, 5) average claim amounts, 6) paid loss ratios, and 7) average premiums at the ZIP code-level across the country from 2018 to 2022.
Highlights
- The growing insurance affordability and availability crisis is not limited to particular coastal states but is spreading rapidly across the country, including in the Midwest and in so-called “climate havens” like inland North Carolina.
- Attacks on federal transparency efforts by insurance regulators in states like Louisiana, North Carolina, and Oklahoma belie serious challenges with insurance affordability and availability revealed by the new data.
- Ongoing collection and publication of localized insurance data will be essential to monitor the full scale of the crisis and to evaluate the impact of rising premiums not just on homeowners but on renters, affordable housing providers, and communities of color.
Insurance companies themselves are vulnerable to extreme weather, but are adept at shifting costs directly to consumers. By spiking premiums, slashing coverage, hiding their cash, and lobbying for regulatory giveaways, insurance companies can generate record profits even amidst escalating disaster costs. In fact, higher premiums are a boon for companies because they enable larger investments — which are insurers’ principal source of profits. Because ordinary consumers and taxpayers, not companies, are set to bear the financial burden, transparent, publicly available data focused on insurance affordability and availability is essential.
While premiums have been rising in many areas for some time, the near-total absence of data on premiums and claims enabled a predictable crisis to fester in the dark. In contrast to health insurance, and much of the banking industry, property insurance is regulated at the state level. The state regulators who oversee insurance markets have allowed a dysfunctional data system to leave the public and regulators in the dark. Until the January 2025 release of the data visualized here, the absence of a public data source left researchers lamenting that the data on the availability of home insurance was itself almost entirely unavailable.
The history of redlining and underinvestment in climate-vulnerable communities makes localized data particularly crucial. Climate risks like flooding and wildfires disproportionately impact marginalized and low-income communities. These same communities also face greater obstacles and longer delays to receive claims and are more likely to be entirely uninsured. Absent targeted policy solutions, insurers’ risk-based determinations could reinforce a negative cycle, while a sudden restriction in their underwriting overall could provide cover for outright discrimination.
Data released this year by Treasury’s Federal Insurance Office (FIO) and in December by the Senate Budget Committee provide a long-awaited window into the insurance crisis. While state-level averages were available previously, the new data is county and ZIP code-level, allowing a much closer geographic analysis than was previously possible. With greater understanding of the impacts on consumers across the country, this data should provide the first step to monitor the crisis, identify vulnerable communities, and inform urgent policy interventions.
Metrics: Defining Them and Why They Matter
- Nonrenewals — Insurance contracts are annual, and insurance companies can inform policyholders that their coverage will not be renewed at the end of the term. While individual nonrenewals occur for a range of reasons, a pattern indicates insurance companies are tightening their underwriting criteria and restricting coverage for properties they deem vulnerable.
- Cancellations due to nonpayment — Insurance companies are allowed to cancel policies when consumers fail to pay, and these cancellations provide a warning sign about affordability limits. While higher premiums may raise the alarm about the risks posed by climate change in the aggregate, the data on cancellations for nonpayment suggest a growing number of people are already being priced out of coverage entirely. For many households, there is no meaningful difference between coverage that is unavailable and coverage that is simply unaffordable.
- Cancellations due to factors other than nonpayment — Regulators restrict the reasons insurers can cancel coverage midway through the policy period. The primary reason is the failure to pay the premiums, but companies also can cancel active policies for other factors, including alleged fraud. Insurance companies are increasingly using aerial imaging, via drone or satellite, to capture images of the homes they insure. These images furnish the insurer with more information than a policyholder may have about their own home — and there is no protection from insurance companies misrepresenting or otherwise misusing them. Given the questionable and secretive data behind them, cancellations deserve additional scrutiny.
- Claim frequency rate — Claims frequency refers to the number of paid claims in a reporting year divided by the number of policies in force at the end of the reporting year. Climate change is contributing not only to catastrophes like wildfires and hurricanes that lead to larger claims, but also to more frequent, smaller events like thunderstorms where smaller claims can also drive costs up quickly. Over time, higher claims frequency could lead insurers to increase deductibles to require policyholders to cover those claims — or could lead to carve-outs for the most frequent claims, such as roof damage.
- Claim severity or amount — Claim severity, or amount, is the size of financial loss resulting from an insurance claim. Even one-time events can alter the perceived insurability of an area, leading to retreat (by reinsurers, in particular) and rapidly spiking premiums. Claims severity can therefore be an important predictor of future premiums, insurers’ reserve funds, and their overall risk assessments.
- Paid loss ratio — The loss ratio measures the relationship between an insurer’s payouts for claims and the premiums it collects, expressed as a percentage. It’s worth noting that insurers can be profitable even if the loss ratio is greater than 100% — that is, payouts exceed premiums collected — because of other profit streams such as investment income.
- Premiums — Premiums are the money policyholders pay to an insurance company for coverage. While premium levels reflect multiple factors, including inflation and building costs, large-scale analysis of insurance premiums highlights how climate-related costs from extreme weather are driving up the cost of coverage.
Data from FIO provides a window into the crisis
While insurance is regulated at the state level, Congress explicitly recognized the need to collect data the states have neglected by establishing the Federal Insurance Office inside the Treasury Department in the wake of the 2008 financial crisis. FIO has the authority to monitor insurance availability and affordability and the potential for insurance market disruptions to fuel systemic risk. After FIO proposed a national data collection in 2022, a subset of state regulators, organized through the National Association of Insurance Commissioners (NAIC), agreed to collect the information.
The resulting data, published in January 2025 by FIO, provides the most comprehensive look at home insurance availability and affordability to date. The results show home insurance is becoming less available and more expensive across the nation. This data covers the period from 2018 to 2022 and includes details on privately-written home insurance by 330 insurance companies. With almost 250 million policies, it covers roughly 80% of the market across 33,000 ZIP codes. To protect the privacy of policyholders and insurers in the published data, FIO did not include data for ZIP codes where there were fewer than 10 insurers or fewer than 50 policies in force.
Despite covering a majority of the market, the data lacks coverage in crucial states. In collecting the data, the NAIC — a trade group representing insurance commissioners that effectively sets policy in many arenas — allowed states to opt out. Substantial data is missing from several key states, including some known to be the hardest-hit by extreme weather and catastrophe losses: Florida, Alabama, Louisiana, Georgia, Indiana, Montana, North Dakota, and Texas.The data gaps for Louisiana and Florida, where networks of financially weak insurers have taken the place of retreating national underwriters, are particularly alarming. However, the states that participated obtained national data for companies that operate in their state, ensuring some data is available for almost every state — since national carriers still operate in most states.
As insurance companies restrict coverage, the one-year term of property insurance contracts creates a unique financial vulnerability. With the power to renew and reprice annually, insurance companies can collect premiums for decades and then simply walk away. Homeowners, by contrast, have far less flexibility to leave their homes and communities. Close attention to the availability and affordability of insurance is essential to inform interventions to protect people and the economy from rash and self-serving actions by insurers.
Table 1. Nonrenewal Rates
This table shows the 100 ZIP codes with the largest growth in nonrenewal rates between 2018 and 2022.
To explore a searchable table with data for all ZIP codes, click here. Insert your ZIP code into the search box to see how the nonrenewal rate in your area has changed over time.
Table 2. Nonpayment Cancellation Rates
This table shows the 100 ZIP codes with the largest growth in nonpayment cancellation rates between 2018 and 2022.
To explore a searchable table with data for all ZIP codes, click here. Insert your ZIP code into the search box to see how the nonpayment cancellation rate in your area has changed over time.
Table 3. Cancellation Rates Due to Other Factors
This table shows the 100 ZIP codes with the largest growth in cancellation rates due to factors other than nonpayment between 2018 and 2022.
To explore a searchable table with data for all ZIP codes, click here. Insert your ZIP code into the search box to see how the cancellation rate due to factors other than nonpayment in your area has changed over time.
Table 4. Claim Frequency Rates
This table shows the 100 ZIP codes with the largest growth in claim frequency rates between 2018 and 2022.
To explore a searchable table with data for all ZIP codes, click here. Insert your ZIP code into the search box to see how the claim frequency rate in your area has changed over time.
Table 5. Average Claim Amounts
This table shows the 100 ZIP codes with the largest growth in average claim amounts between 2018 and 2022.
To explore a searchable table with data for all ZIP codes, click here. Insert your ZIP code into the search box to see how the average claim amount in your area has changed over time.
Table 6. Paid Loss Ratios
This table shows the 100 ZIP codes with the largest growth in paid loss ratios between 2018 and 2022.
To explore a searchable table with data for all ZIP codes, click here. Insert your ZIP code into the search box to see how the paid loss ratio in your area has changed over time.
Table 7. Average Premiums
This table shows the 100 ZIP codes with the largest growth in average premiums between 2018 and 2022.
To explore a searchable table with data for all ZIP codes, click here. Insert your ZIP code into the search box to see how the average premium in your area has changed over time.
Senate investigation reveals troubling patterns
Roughly a month before FIO released its report, the Senate Budget Committee, led by then-Chair Sheldon Whitehouse (D), published a report that included original data on nonrenewal rates across U.S. counties from 2018 to 2023. The data include national, county-level nonrenewal data from nearly two dozen companies, covering 65 percent of the national homeowners’ insurance market. The data reveal that nonrenewal rates are rising fast around the country, and the counties with the greatest climate risk are experiencing the fastest increases.
Map 2. County-Level Data
This interactive map, built using data released by the Senate Budget Committee, shows nonrenewal rates at the county level from 2018 to 2023.
Table 8. County-Level Nonrenewal Rates
This table shows the 100 counties with the largest growth in nonrenewal rates between 2018 and 2023.
To explore a searchable table with data for all counties, click here. Insert your county into the search box to see how the nonrenewal rate in your area has changed over time.
Table 9. Statewide Average Nonrenewal Rates
This table shows statewide average nonrenewal rates from 2018 to 2023.
Conclusion
Data from FIO and the Senate Budget Committee provide an important step forward in understanding a growing crisis. However, this data should be seen as a starting point for ongoing quarterly collections. Additional information is needed to understand the full scale of the problem.
Future data collections should be expanded to include data on additional groups and data points to cover the full extent of the crisis. Documenting the impact on renters, who pay through higher rent, is particularly important — as is data on insurance availability for affordable housing providers, many of whom are currently struggling to find any coverage at all. With more granular data, ideally at a census tract level, analysis of the affordability and availability for particular demographic groups will be possible. Data on the adequacy of insurance (whether a policyholder’s coverage is sufficient) will also become particularly important as more policyholders experience total losses.
While performing future collections, state regulators and FIO should also move quickly to develop a database available to the public. With greater access to data, policymakers, researchers and communities can make informed decisions about how to adapt insurance regulation and proactively invest in climate mitigation and adaptation.
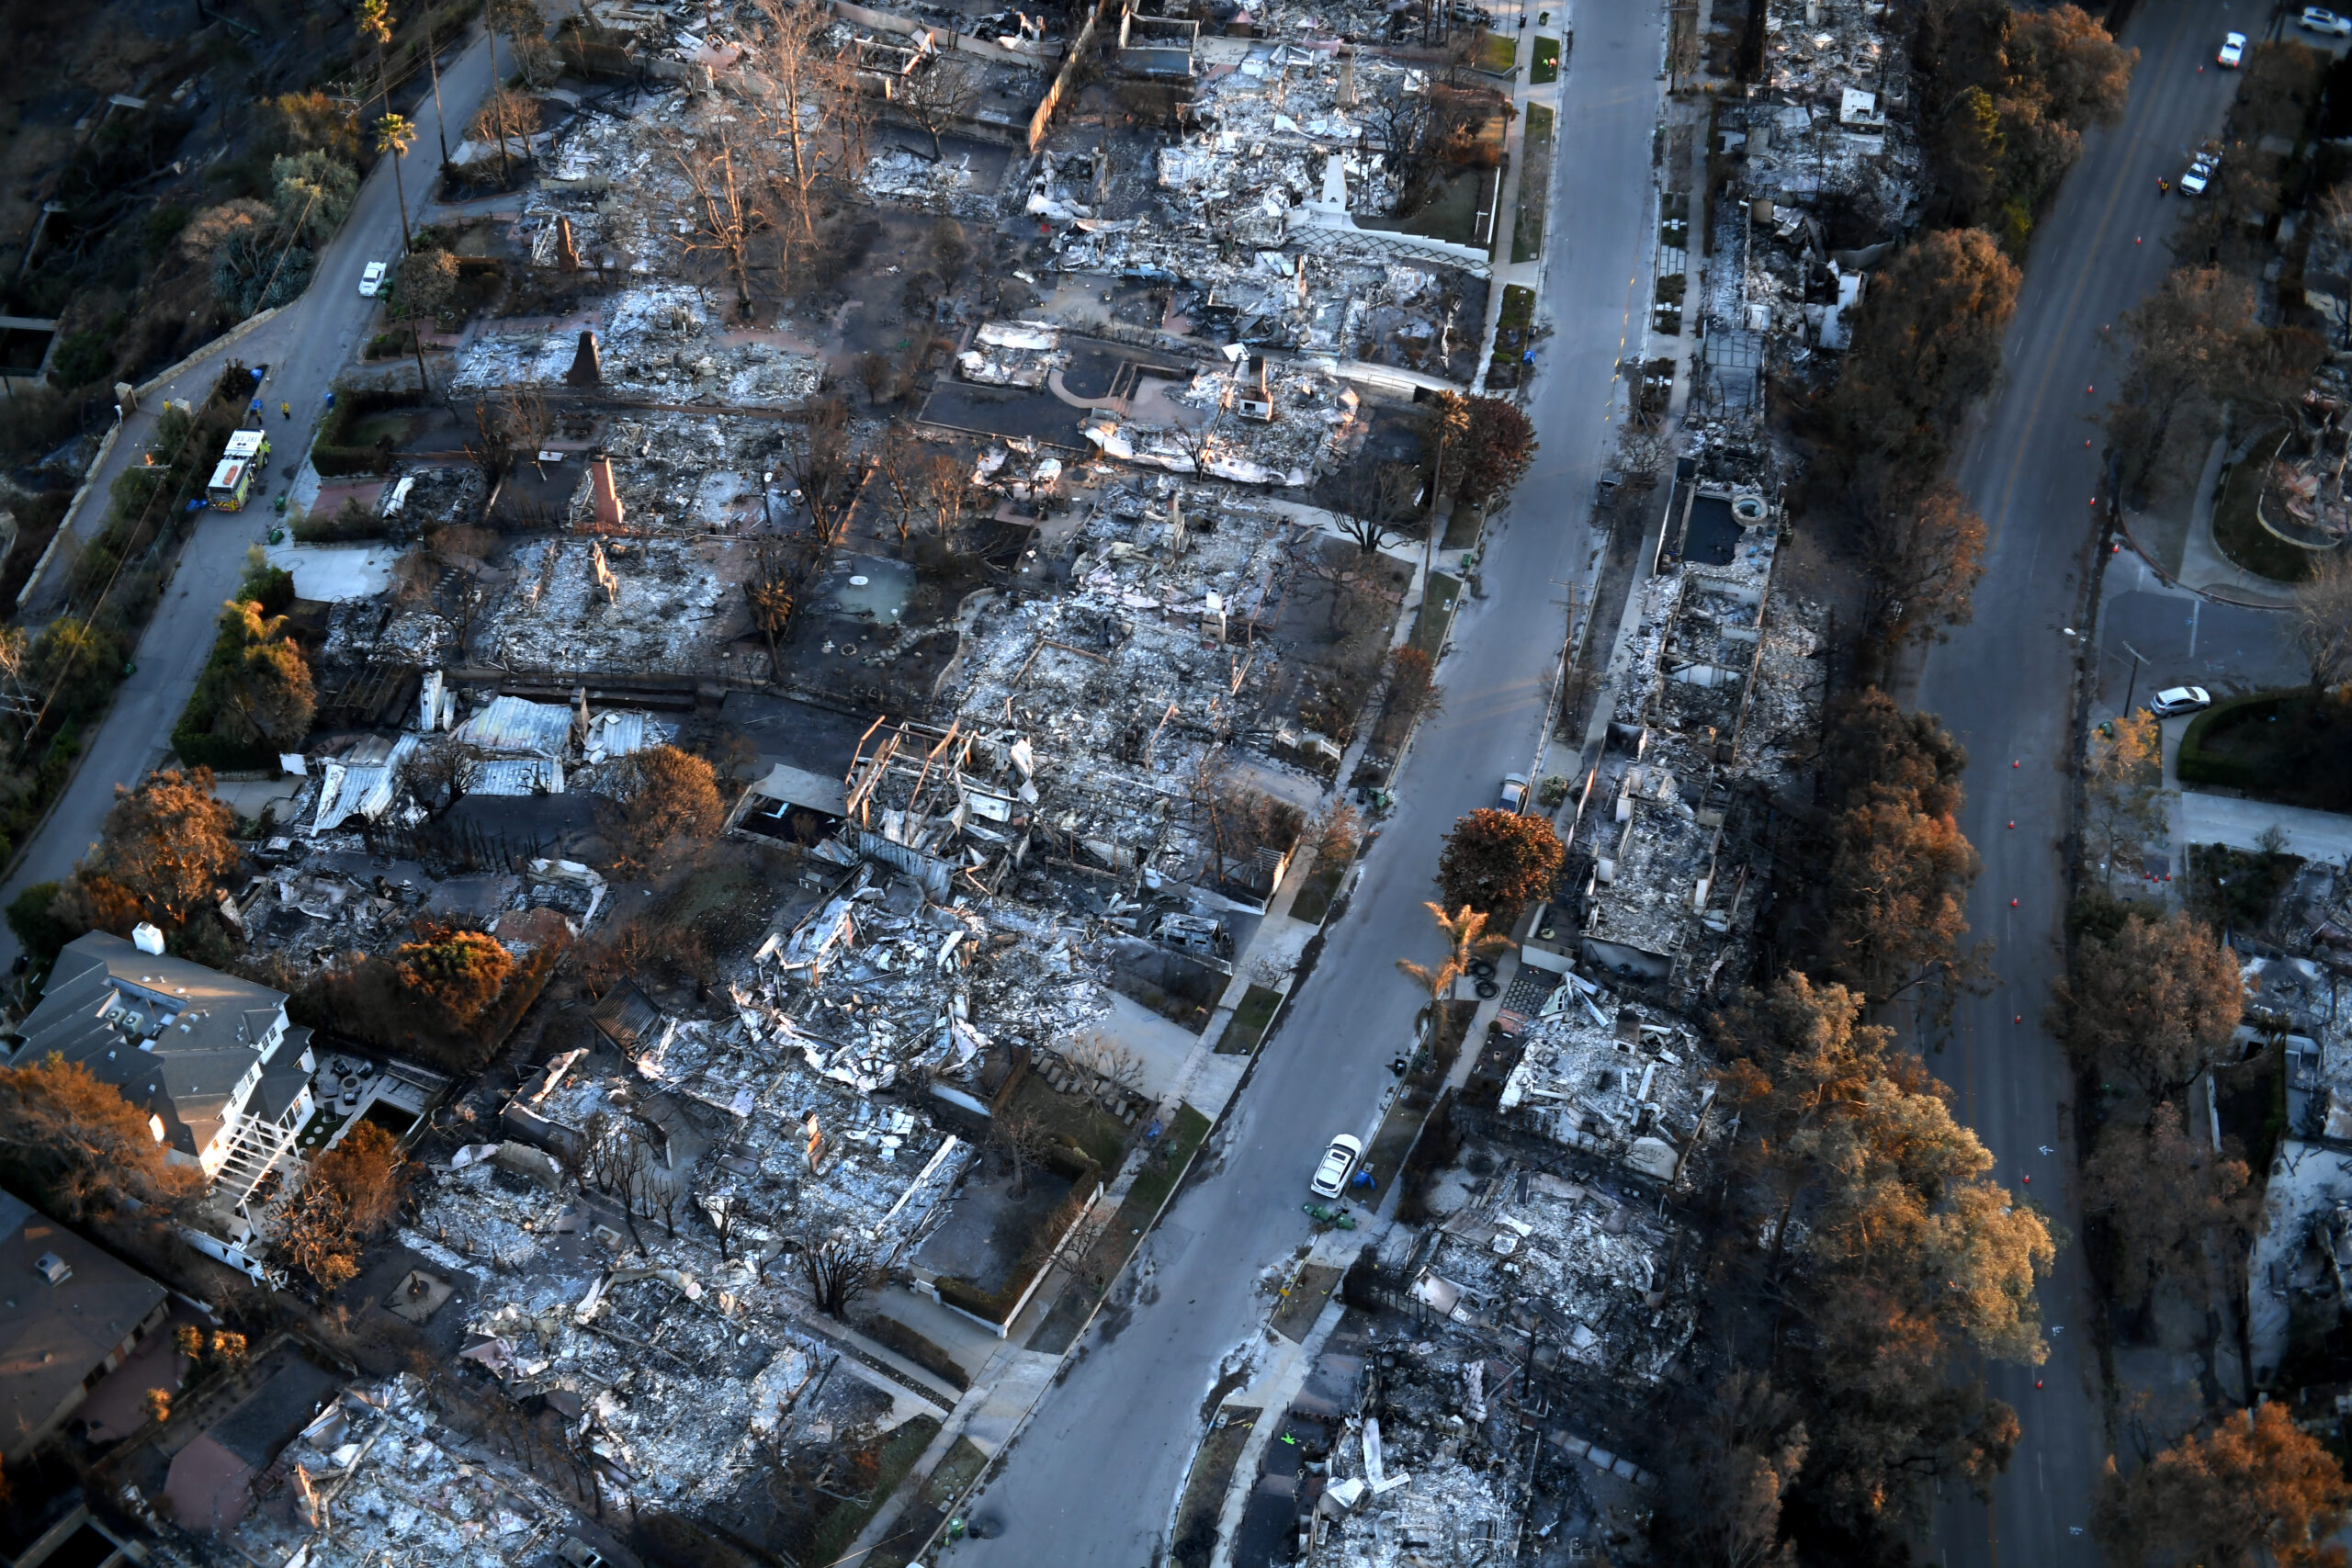
Photo 1: An aerial view of damage from the Palisades Fire in Los Angeles County, California. Taken in January 2025 by the California National Guard and licensed under CC BY 2.0.
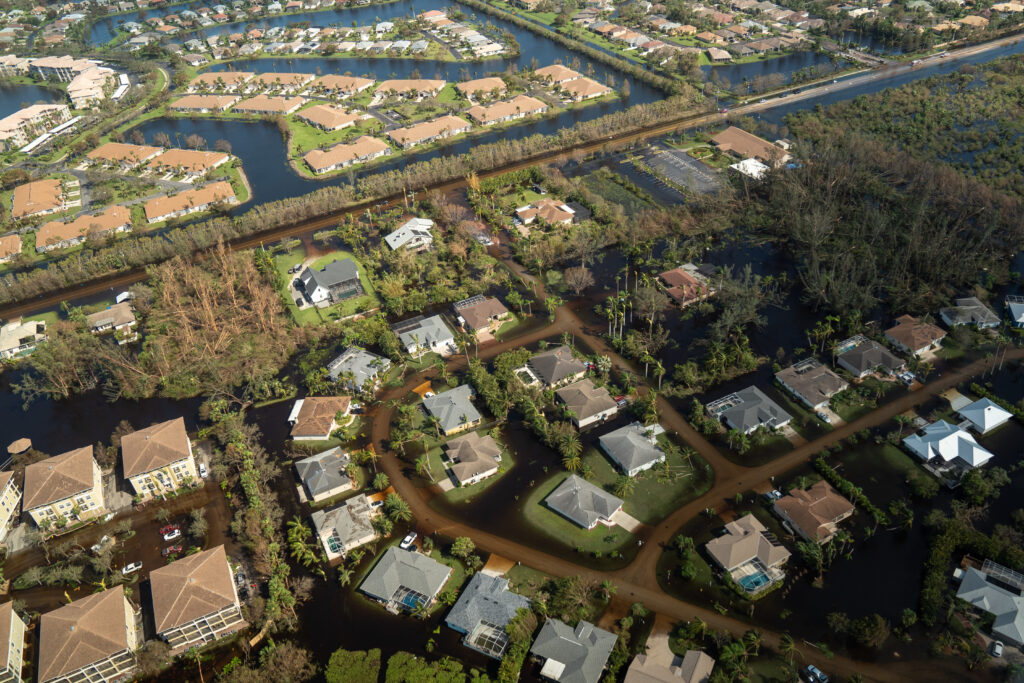
Photo 2: An aerial view of damage from Hurricane Ian in Lee County, Florida. Taken in September 2022 by state officials and licensed under CC BY-ND 2.0.